This is a quick update on hate, the Human Agentic Tracking Engine. It’s getting traction in two or three different places, and that has turned up some interesting use cases and some things that needed tweaking.
To start with, the original tool did a kind of resource leveling. I fiddled with it quite a bit and never quite got it the way I liked. The new version adds a Monte Carlo approach that runs a range of estimates on hours. It takes the tickets and plays the project out over and over, with some features running over and some running under, and comes up with P50, P85 and P95 values for the question that matters: is the project going to end on time?
After playing with it, this really feels like the right approach. We size projects in COSMIC function points, and with Claude (or ChatGPT, or any of these tools) doing the counting, the counting is now pretty strict. So you can generally trust that the size of the project is being estimated consistently. What you may not know is the actual rate, the hours per function point. That varies by domain, and possibly even by project type within a domain. And inevitably every project manager asks: when do we think we’ll be done? Are we on track? Monte Carlo gives you a much more realistic feel for whether you really are or aren’t.
The rest of this article walks through the changes that went in, why they went in, and how they help you as a developer or a project manager.
One other quick note. I have coworkers using this, and I asked one of them for input on defects or changes to the tool. He brought up one point and asked if I could add it. Then he said, to be fair, “I don’t even use the UI. I just tell Claude to go update the tickets.” That is precisely the use case I was after. The old days of people clicking through a user interface to do things are, I think, largely fading. He confirmed he can use the tool just the way I do: through the user interface, or by having Claude work with it directly to update tickets, do the promotions and log time. He took the tickets assigned to him and had Claude analyze them. Claude pulled the code tagged for review, and he reviewed it, made the changes and opened the PRs. So now I’m seeing really good usage across multiple developers, which validates the whole approach of Git with JSON as the underlying structure.
In one working day, hate went from v1.0.11 to v1.0.17. That’s six releases and fifteen commits. Some of the changes came from real use: a coworker on Windows, and a client PM looking at a baselined dashboard. Others came from things that only turned up once we looked closely. This article covers what changed and why. It ends with a longer discussion of how hate estimates a project with Monte Carlo, and what the two finish dates on the PM dashboard actually mean.
All screenshots were taken with headless Chromium against a sandbox copy of the projects, so no real project data was changed.
Part 1: What changed and why
1. Export to Excel (v1.0.12)
Why: PMs report to clients in Excel. Until now hate could only give them CSVs and a draw.io Gantt.
The backstory: Here’s the situation. A project manager installed hate, and this PM was used to other tools. He was still in what I’ll call the legacy mindset: you go into a tool, you add tickets, you drag slider bars around. On top of that, the client was used to seeing things in Jira. Clearly they’re not one and the same. hate is not Jira. So the PM needed an export. I had Claude export it, and the PM then went into Jira and recreated all of the tickets.
This is the exact thing I’ve written about in prior articles. Project management as a profession really has to get out of this mindset where we go in, manually create tickets and drag sliders around.
The good news in this case is that the PM is looking in hate to update the tickets in Jira, and he’s not involving developers. Developers don’t have to get on a call and tell him, “Oh yeah, I did 2 hours here, that ticket’s done.” We set the expectation that he would use hate, and if he wants to update another tool in parallel, that’s his business. Go ahead. But he doesn’t have to get all of the developers on a call to figure out where we are on the project.
What: an Export to Excel button on the Tickets toolbar downloads one .xlsx workbook with two sheets:
- Tickets: every ticket, including closed and backlog tickets, with status, assignee, phase, class, CFP, estimated and logged hours, dates, predecessors and tags. Dates are real Excel dates and hours are real numbers, so sorting, filtering and sums work. The header row is frozen and has an autofilter.
- Gantt: a classic cell-grid Gantt, with one row per ticket and one column per working day (or per week on long projects), filled in the dashboard’s status colors. Rows are grouped by block or person, critical-path tickets are marked
!, and a note says whether this is the baseline or a projection.
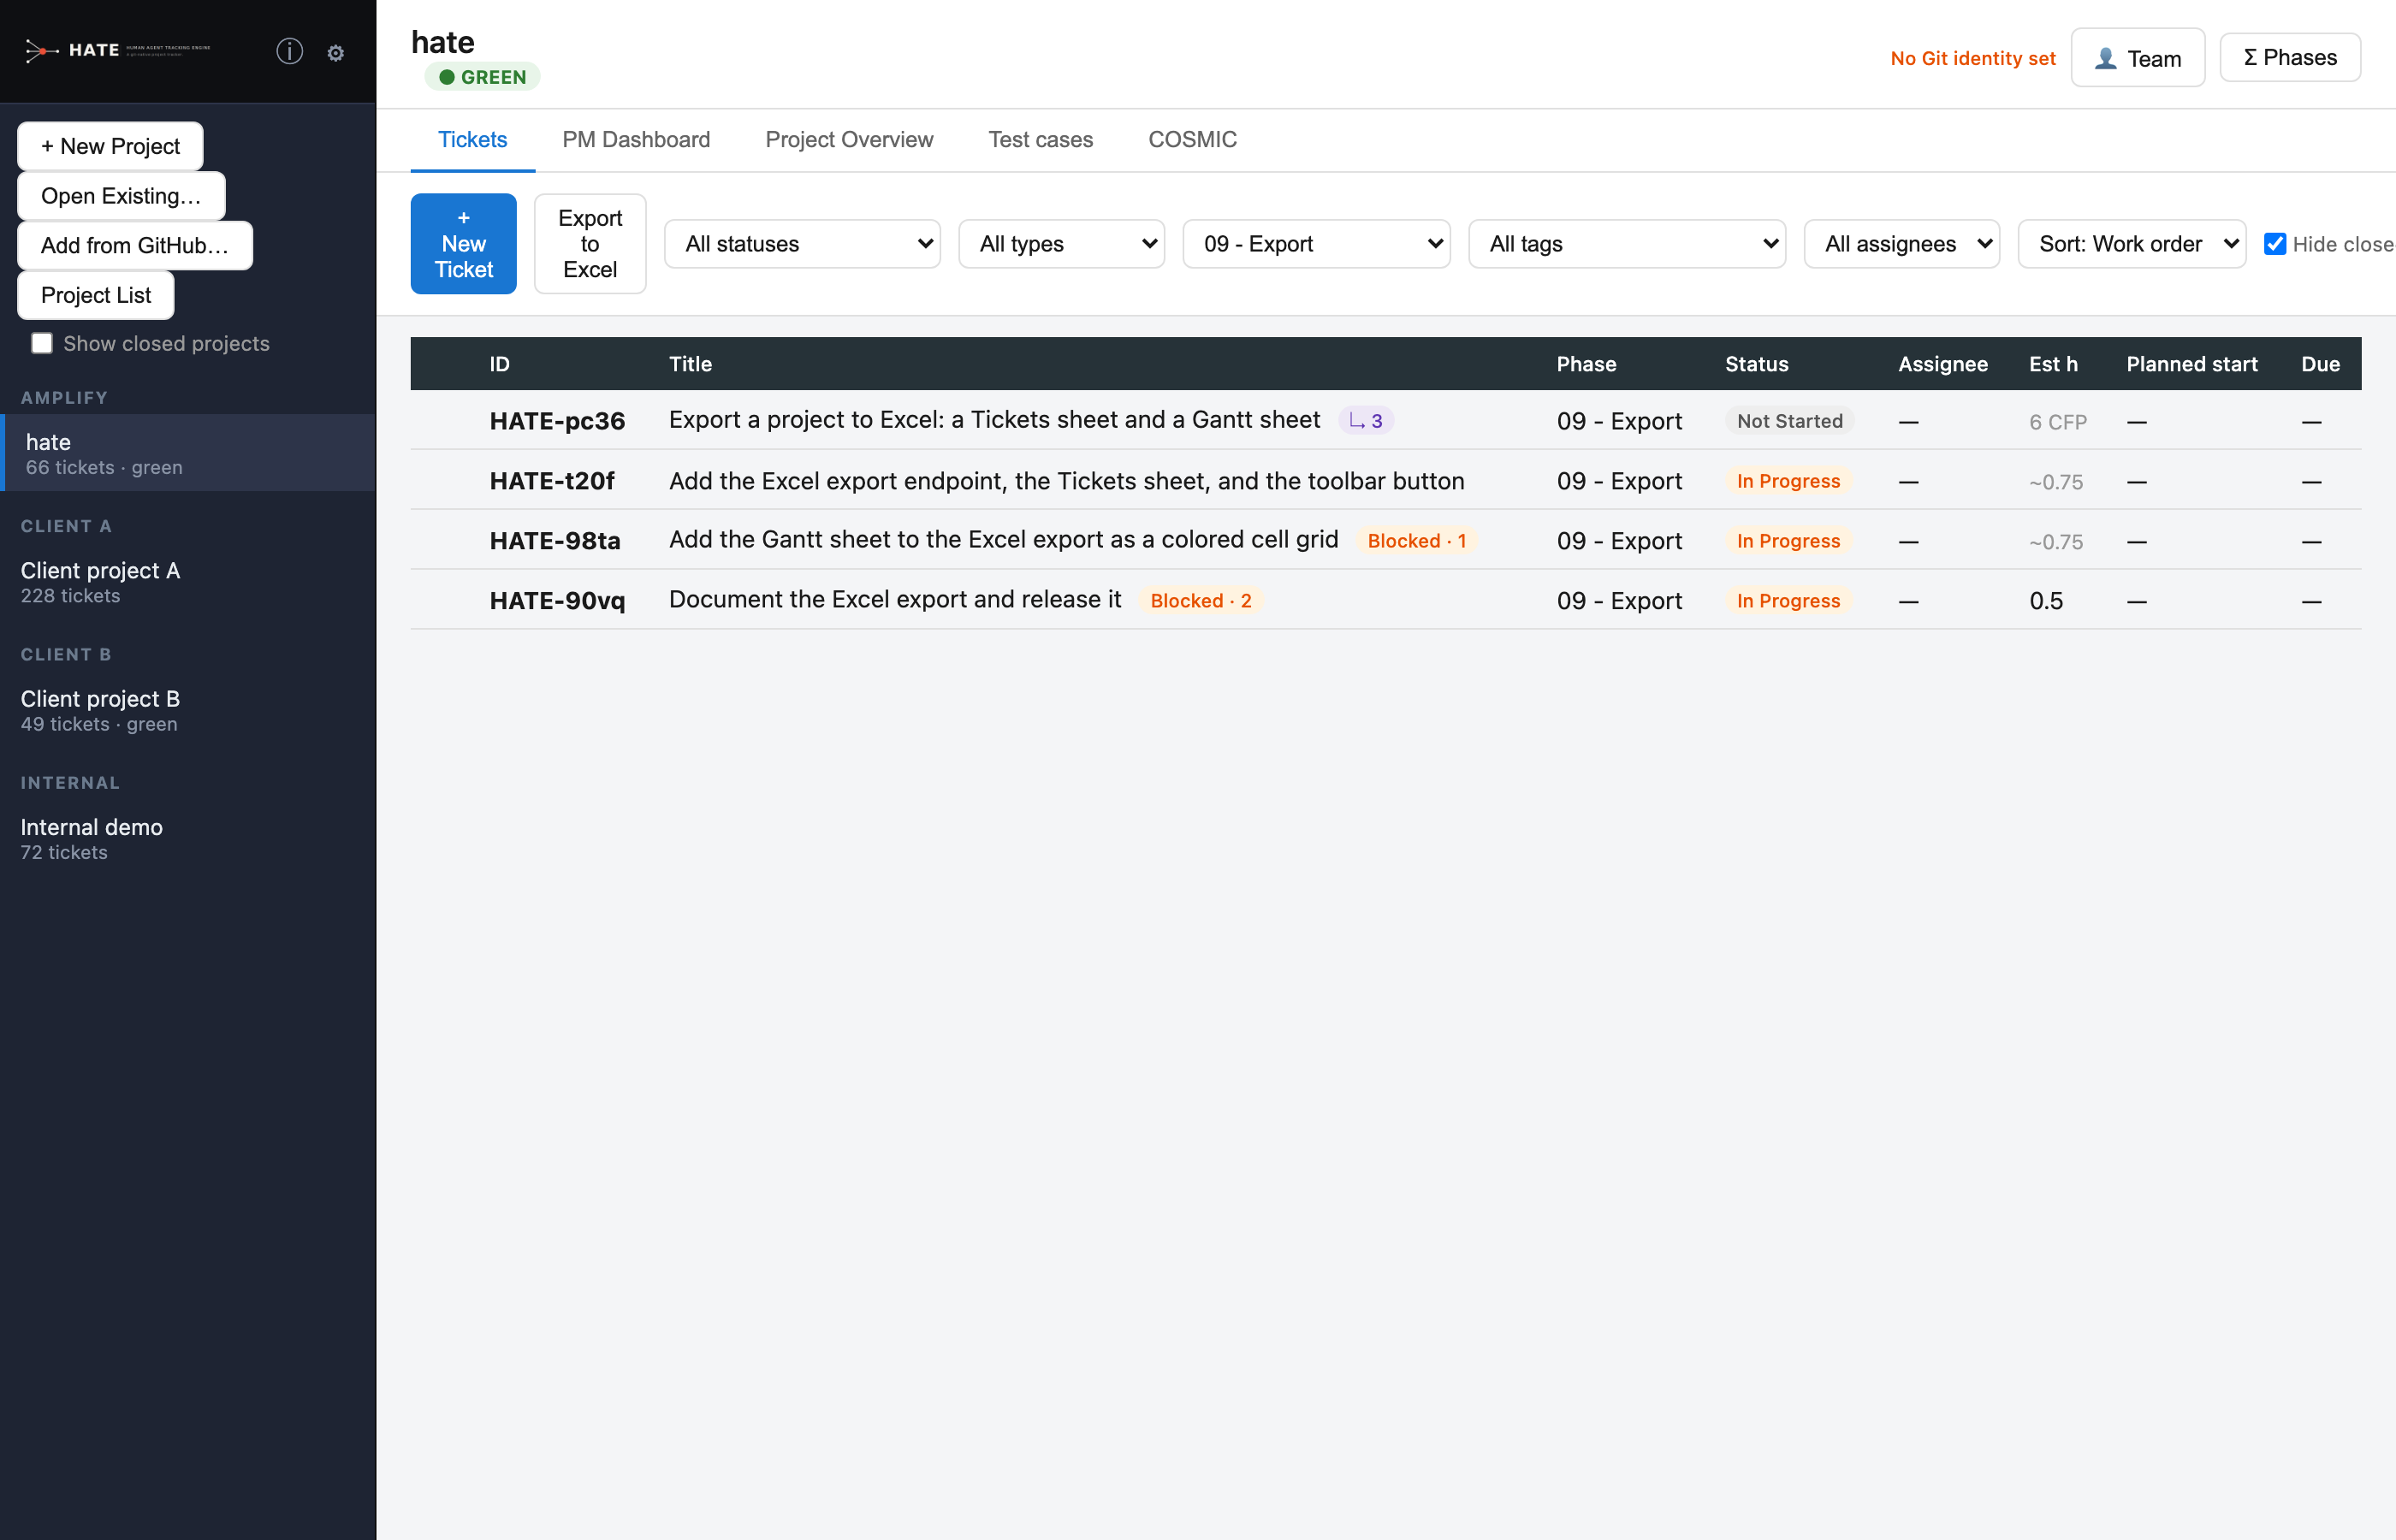
Tickets tab with the Export to Excel button, filtered to one phase
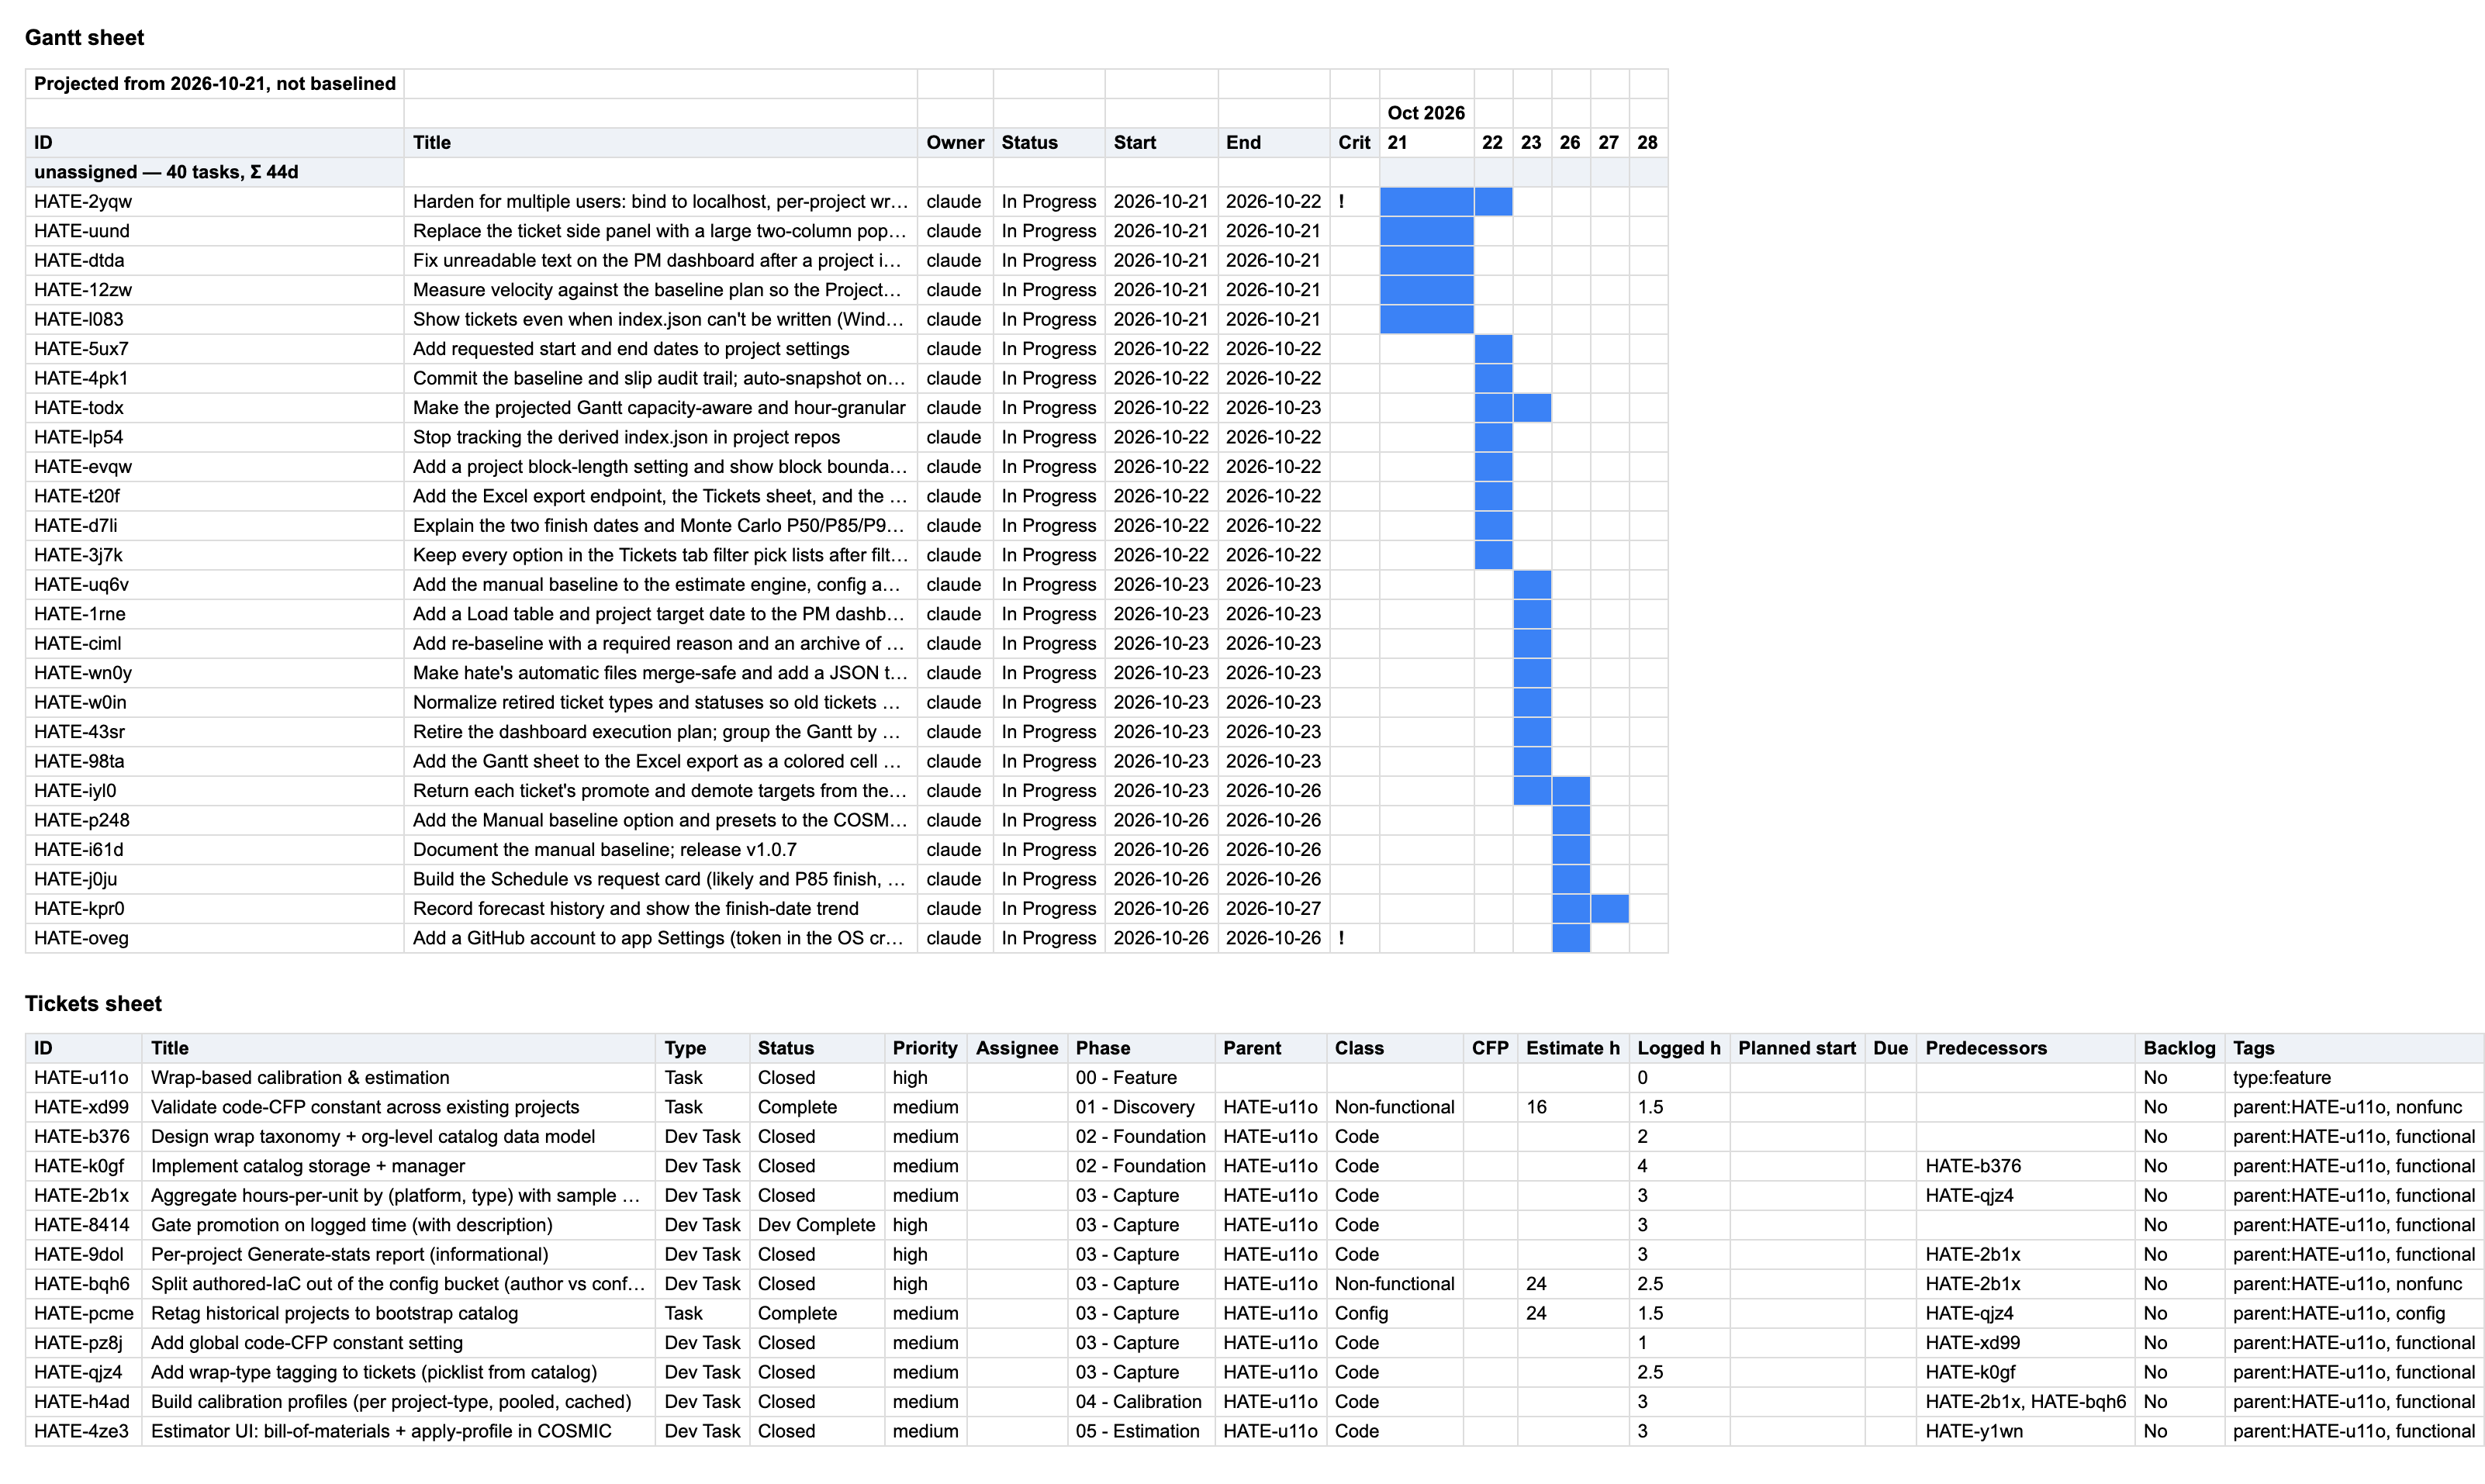
The exported workbook, rendered from the .xlsx file
The second image is the exported file, rendered to HTML from the cell values and fills. It isn’t a screenshot of Excel itself.
Design decisions:
- A cell grid, not a native Excel chart. It opens the same in Excel, Google Sheets and Numbers, and a PM can edit it.
- No new dependency. The
.xlsxis written by hand with Go’s standardarchive/zipandencoding/xml. hate still depends only on chi and go-keyring. - Same schedule as the existing draw.io export, so the two exports can never disagree.
2. The ticket window became a pop-out (v1.0.12)
Why: clicking a ticket opened a narrow sidebar that stacked everything into one column, which made it hard to read. Two alternatives were considered and rejected. A bottom panel squeezes both the list and the ticket on a laptop screen. A separate browser window brings popup blockers and goes stale.
What: a large two-column modal. The description, test cases and comments are on the left. The actions and fields are on the right and stay visible while you scroll. Esc closes it, Up/Down moves to the previous/next ticket in the current filter, and each ticket has its own link (#ticket/HATE-xxxx), so “open in new tab” works.
3. Promote and Demote say where they go (v1.0.12)
Why: the buttons used to say only “Promote” and “Demote”. The workflow differs by ticket type: a task has 4 steps, a dev task has 6 plus a rework loop, and a design task has a review cycle. You couldn’t tell what a click would do.
What: the buttons now name their target (Promote to Dev Complete, Demote to Not Started, Unblock to In Progress). A strip above them shows the type’s whole path with the current status highlighted. The targets come from the server, so the browser never holds its own copy of the workflow that could drift.
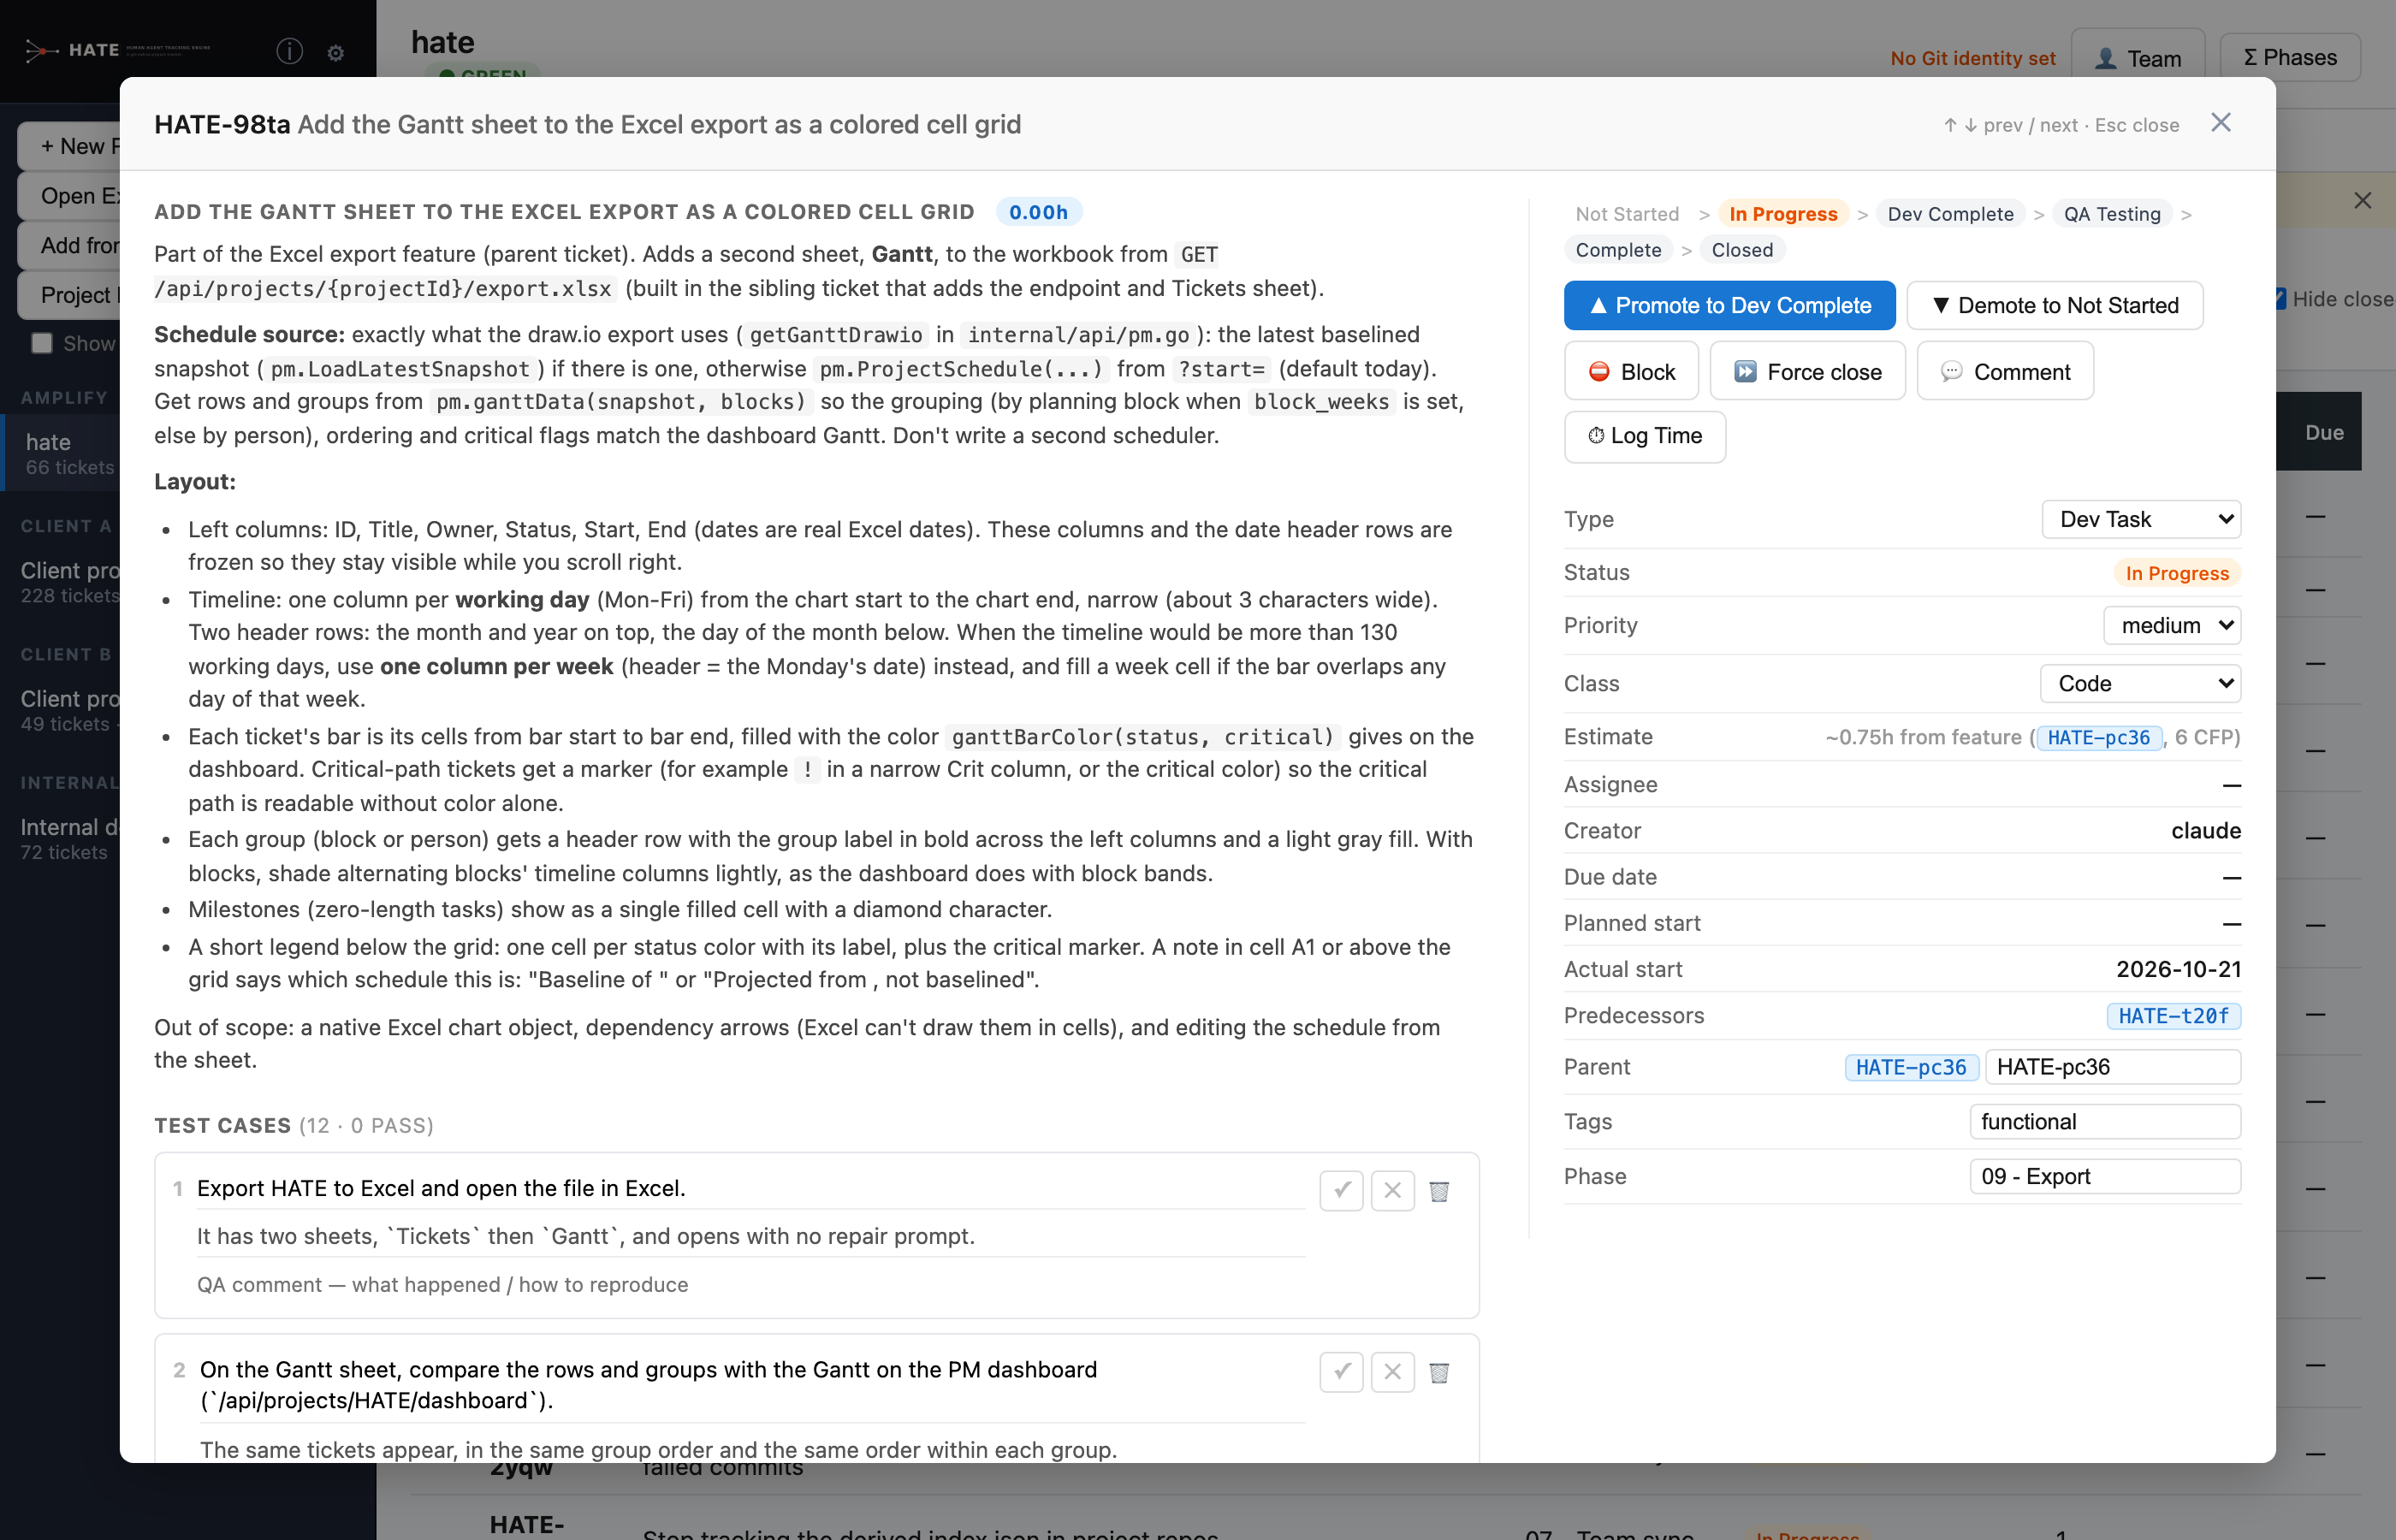
The ticket modal: two columns, labeled promote/demote buttons and the status path strip
4. The PM dashboard is readable after a baseline (v1.0.12, v1.0.13)
Why: on a baselined project the dashboard’s lower panels showed light-gray text on white, which was close to invisible.
Cause: hate has two dashboard pages. Before a baseline it renders a light page; after a baseline it rendered a dark one. The panels shared by both pages were written for the light page: they hardcoded white backgrounds but took their text color from the page. On the dark page that text color was light gray.
What: one light theme before and after a baseline. Every shared panel now sets its own dark text, and text colors were darkened to at least 4.5:1 contrast. A test fails if the dark palette or low-contrast text comes back. A follow-up (v1.0.13) fixed the last low-contrast green on the pre-baseline page.
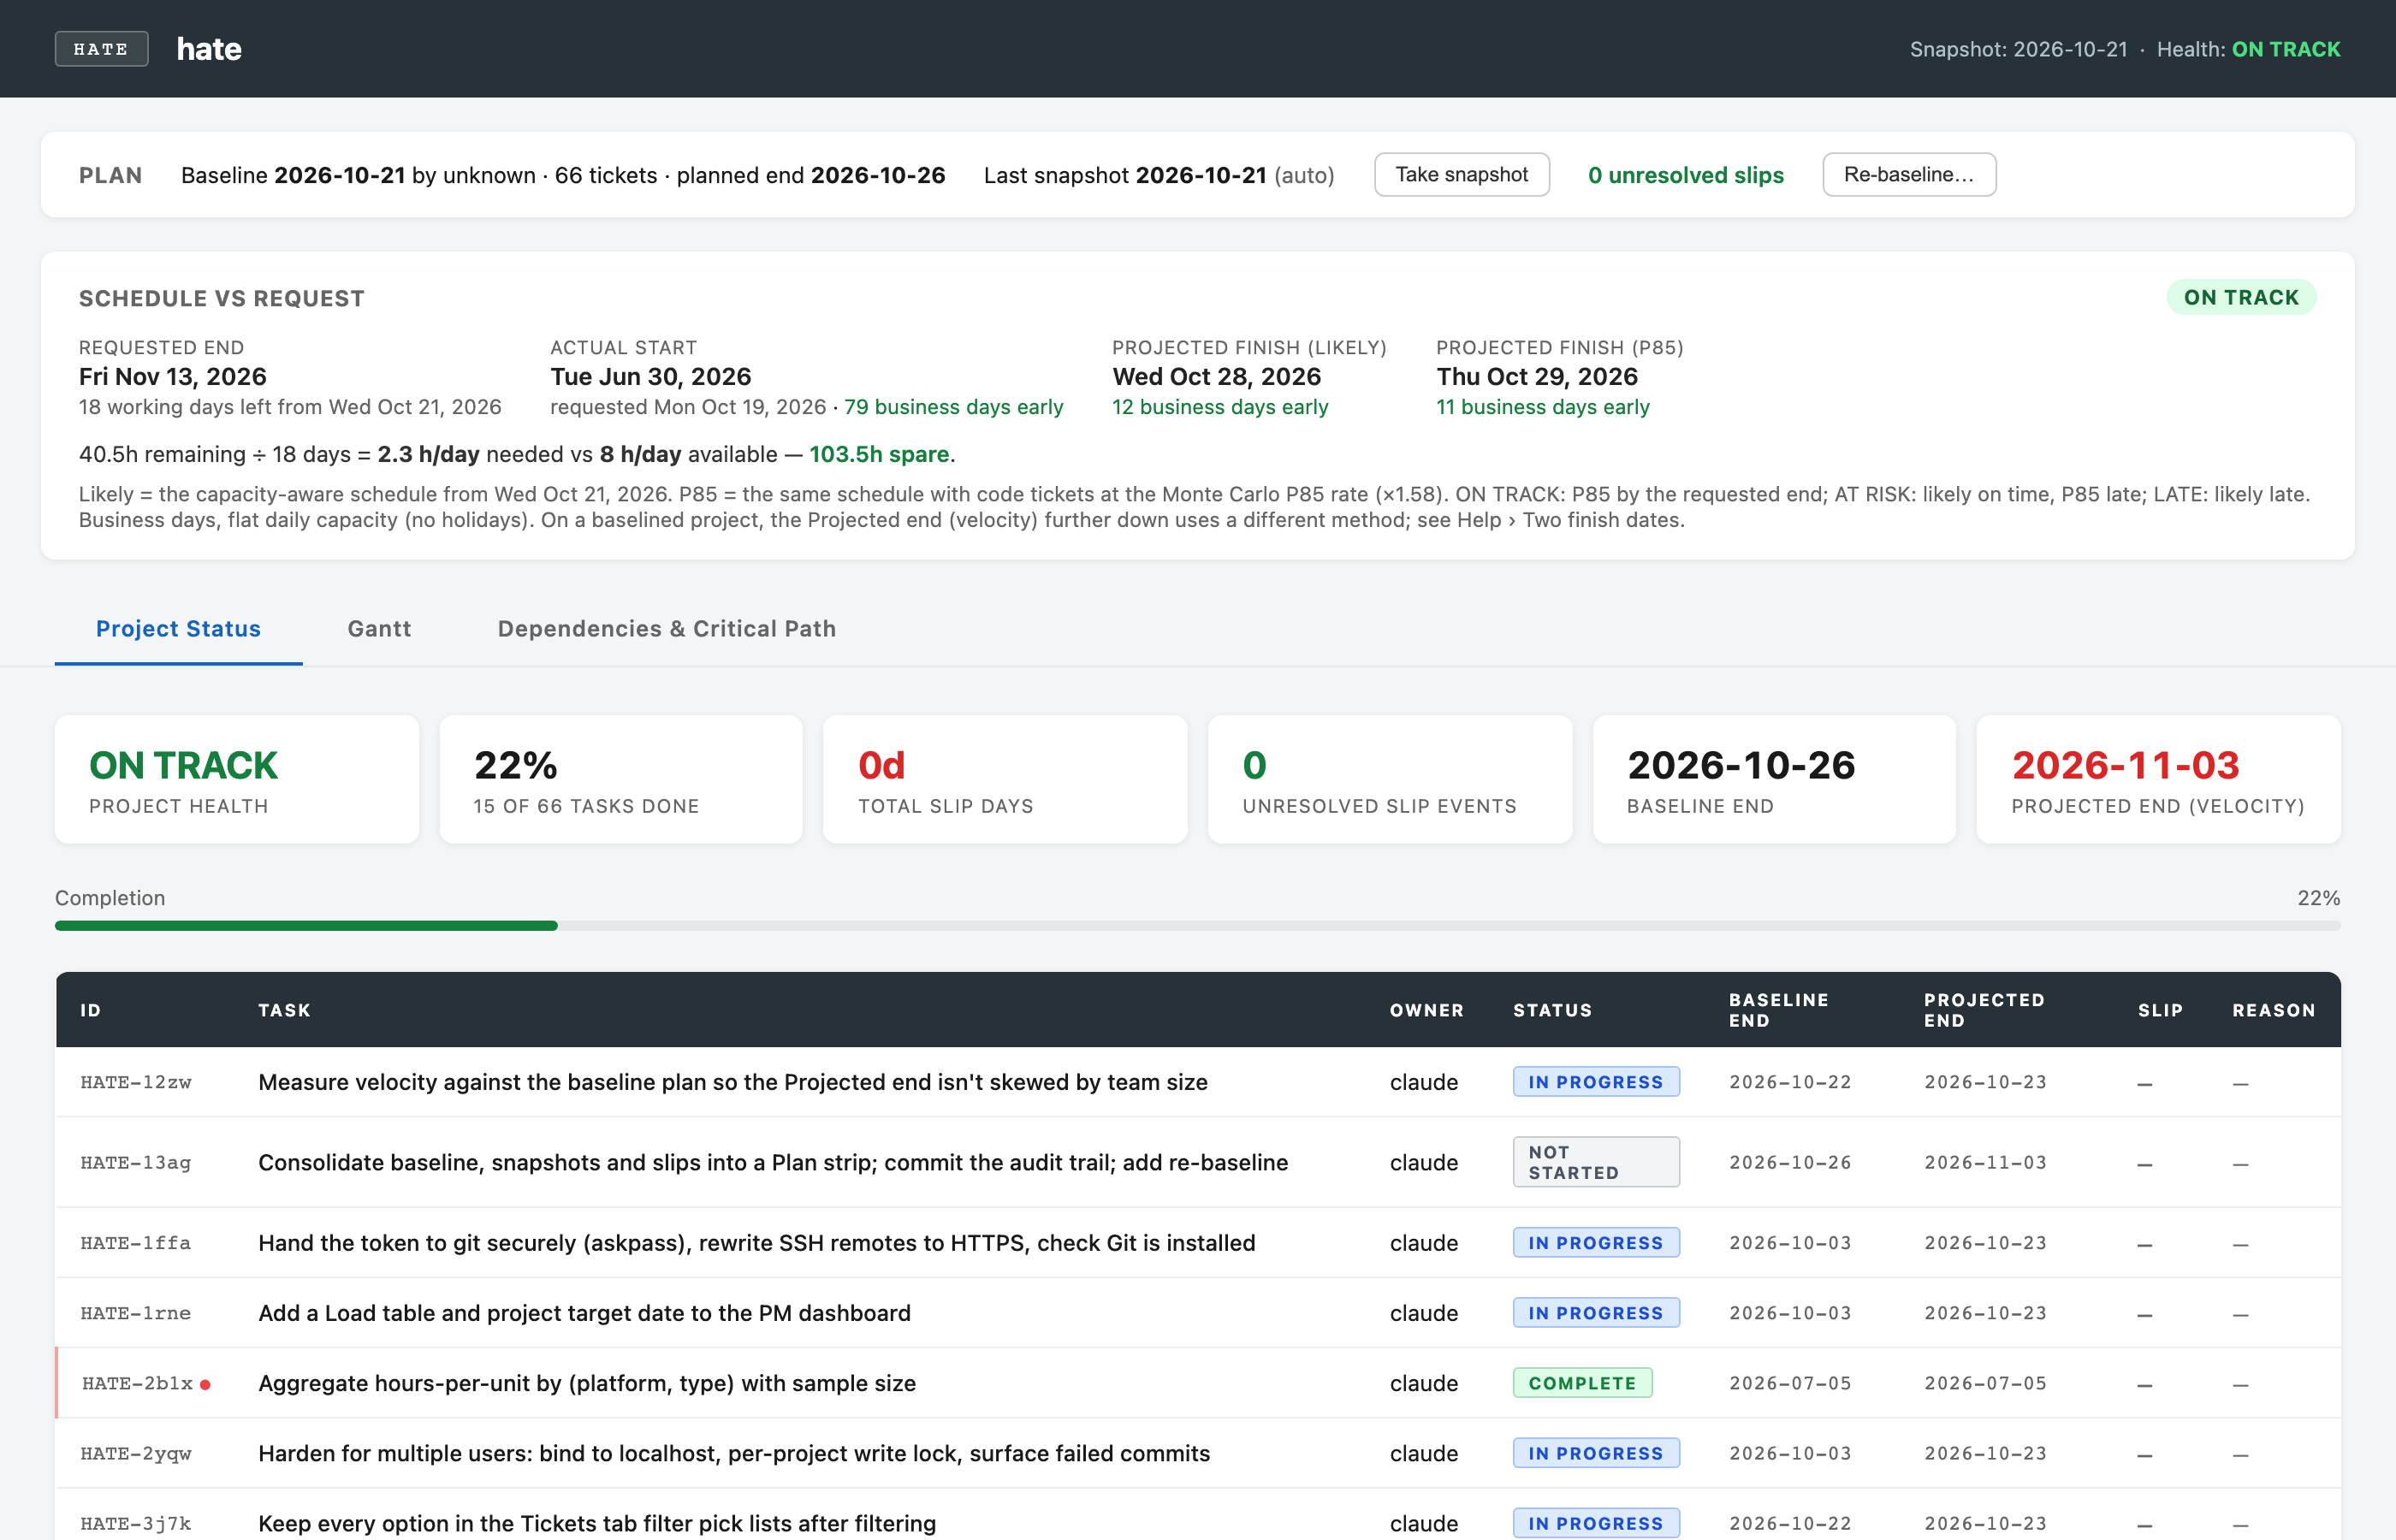
The pre-baseline dashboard
5. Small fixes
- Filters keep every option (v1.0.14). After you picked a phase, the phase dropdown only offered that phase, so getting to another one meant going back through “All phases”. The tag and assignee dropdowns shrank the same way. All three are now built from the full ticket list.
- Status changes accept the author either way (v1.0.13). Promote and demote read the author only from the URL, and force-close only from the body. A caller using the other style silently recorded no author. All four status endpoints now accept both.
6. The Windows “no tickets” bug (v1.0.15)
What happened: a coworker opened a project on Windows and saw no tickets and no error. It took a long remote session to debug.
Cause: index.json is a summary file built from the ticket files. Since v1.0.10 it isn’t committed to git, so a fresh clone doesn’t have one. The ticket list rebuilt index.json, ignored any error, then read tickets back from the file, and a missing file counted as “zero tickets”. On Windows the rebuild can fail: it writes a temp file and renames it over index.json, and Windows refuses that rename while Defender, OneDrive or another reader has the file open. One silent failure on a fresh clone meant an empty project.
There was a worse problem underneath. Every ticket write (create, edit, promote, log time) also rebuilt index.json and returned HTTP 500 if that failed. By then the ticket was already saved, and the commit was skipped. So on Windows, edits looked like they had failed, landed on disk anyway, and were never committed.
What: hate never reads index.json back. The ticket list, billing and the project-list counts all come straight from the ticket files. index.json is still written for outside tools, but a failed write is logged (index.json write failed (...)) and never fails a request or skips a commit. A ticket file that can’t be read or parsed is now logged by name instead of silently disappearing. A test turns index.json into a folder, so every write fails, and checks that everything still works. That test fails on the old code.
7. Two finish dates, explained (v1.0.16)
Why: a client PM saw two different finish dates on a baselined dashboard and asked which one was right.
What: a new Help section, 6a. Two finish dates: why they differ, which also explains Monte Carlo in plain language (Part 2 below). The dashboard card now reads Projected end (velocity), and the Schedule vs request footnote points to the Help section.
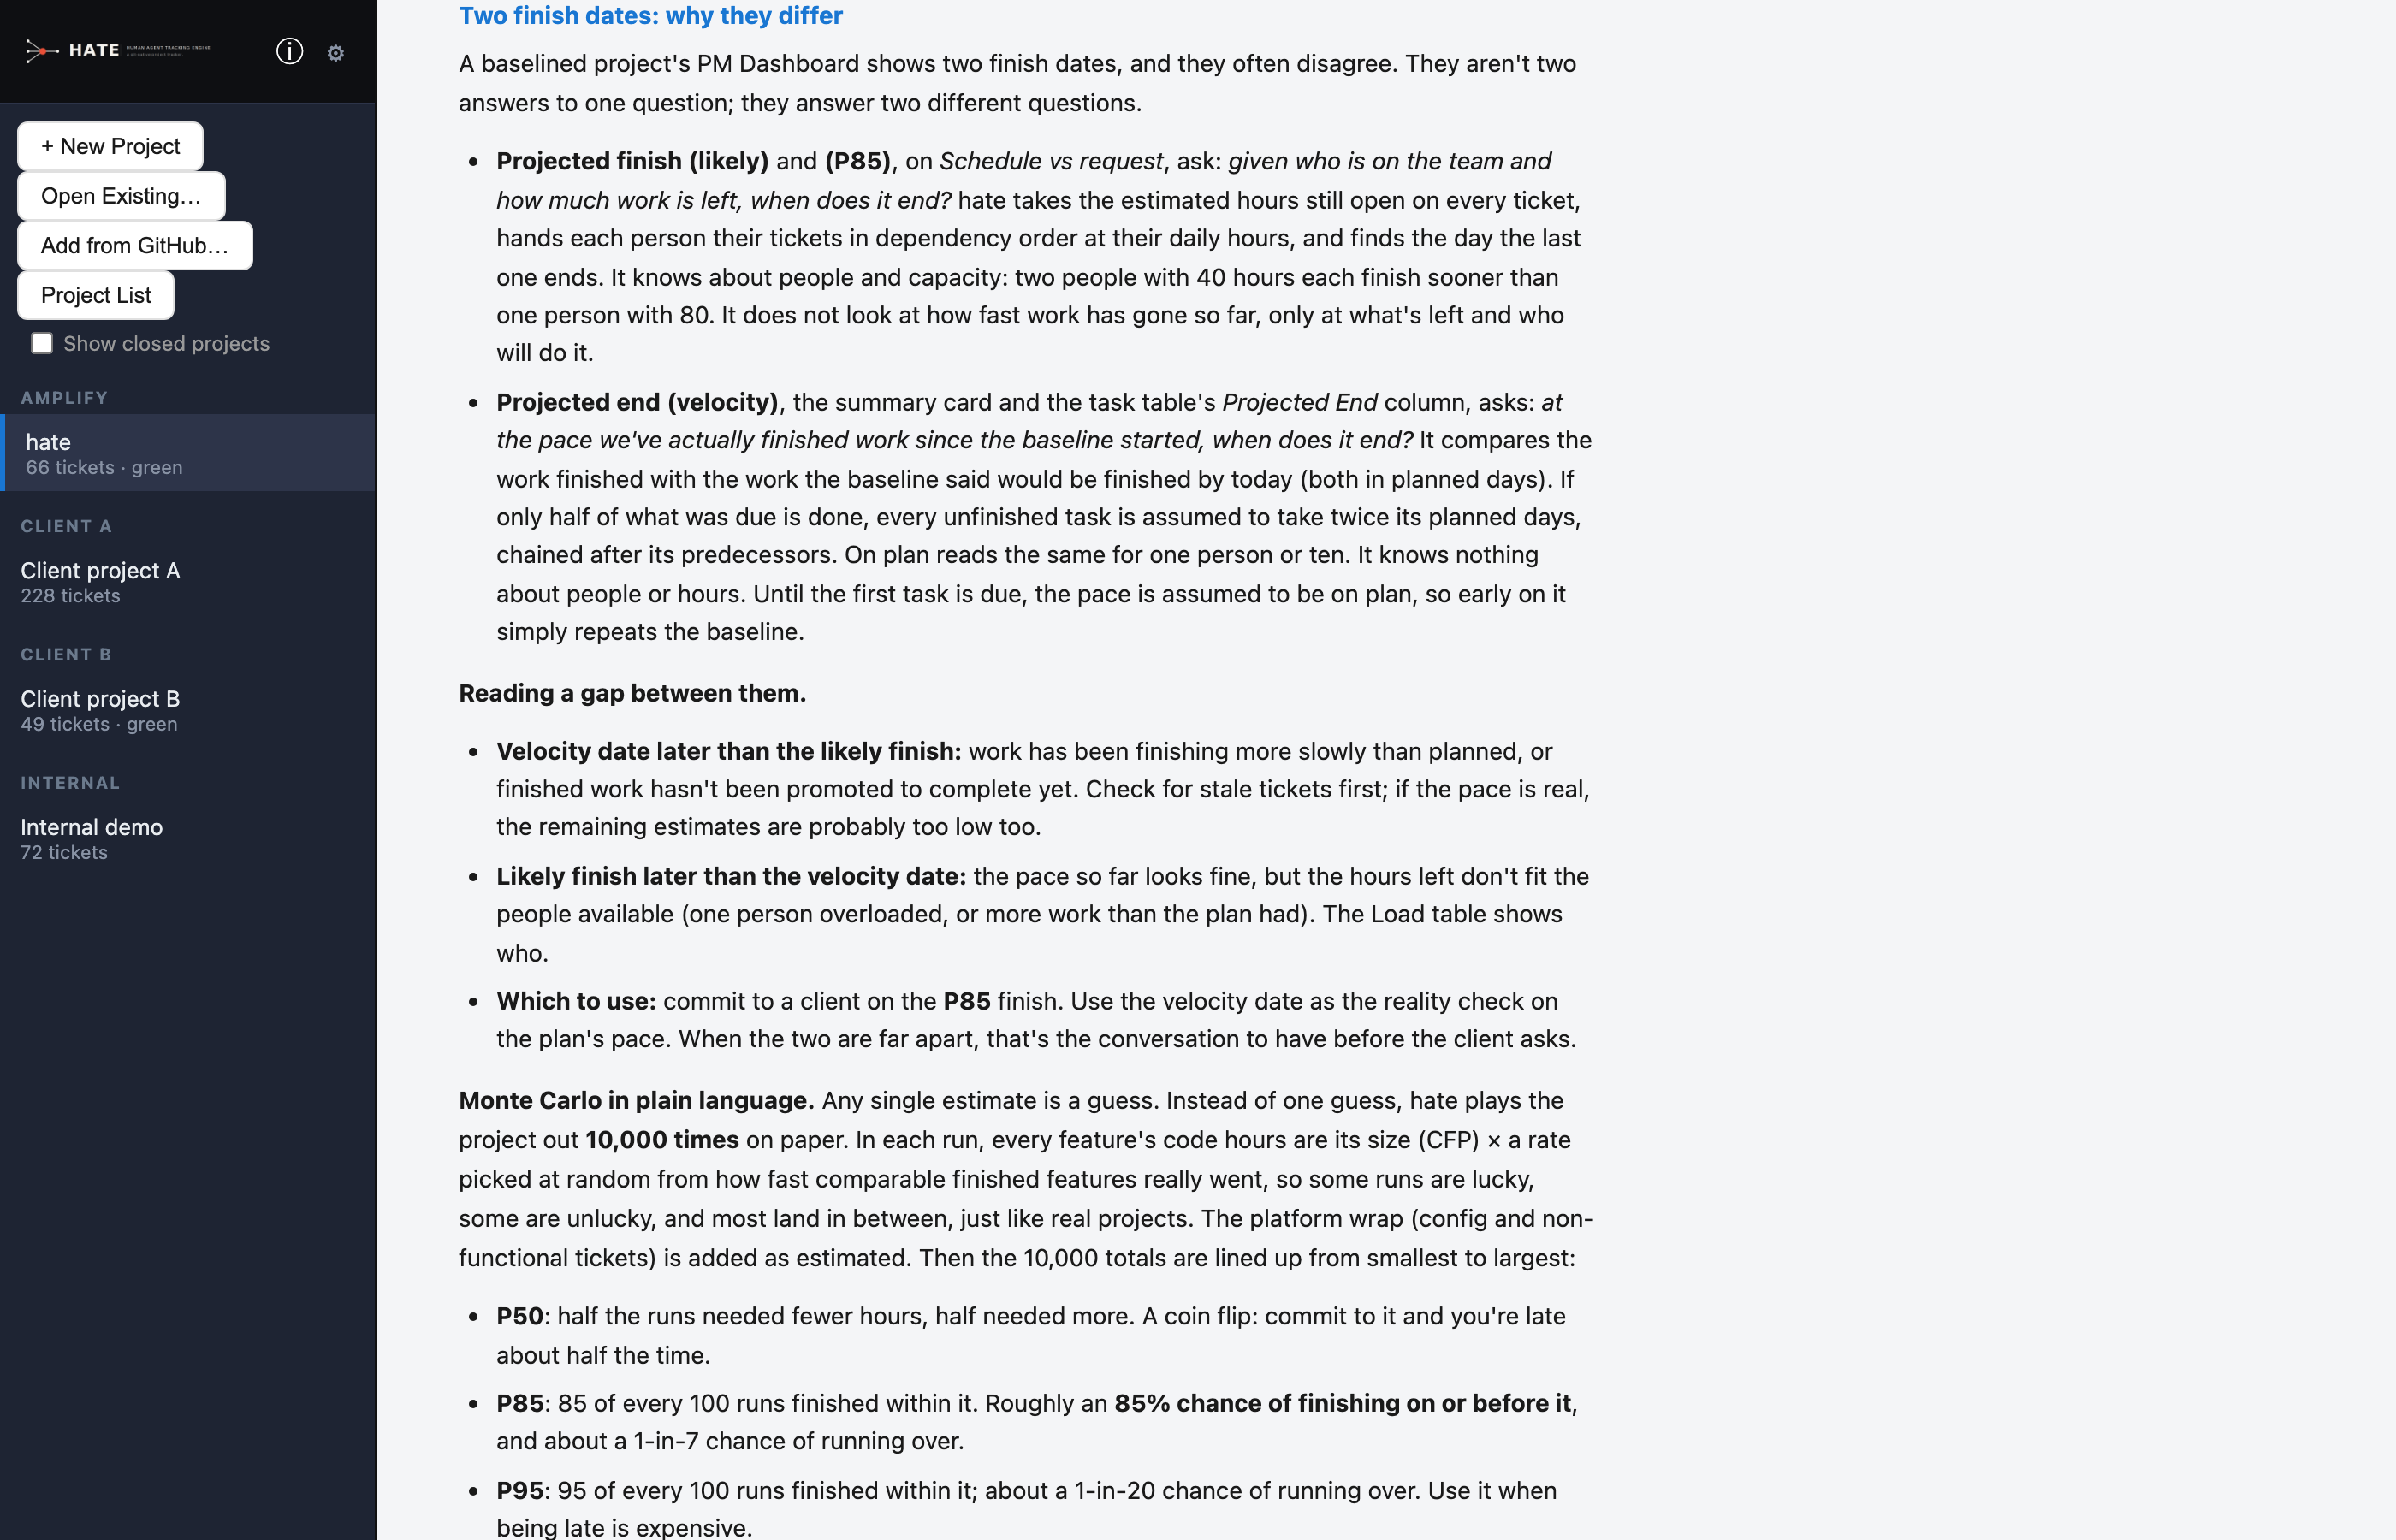
Help section 6a
8. Velocity no longer depends on team size (v1.0.17)
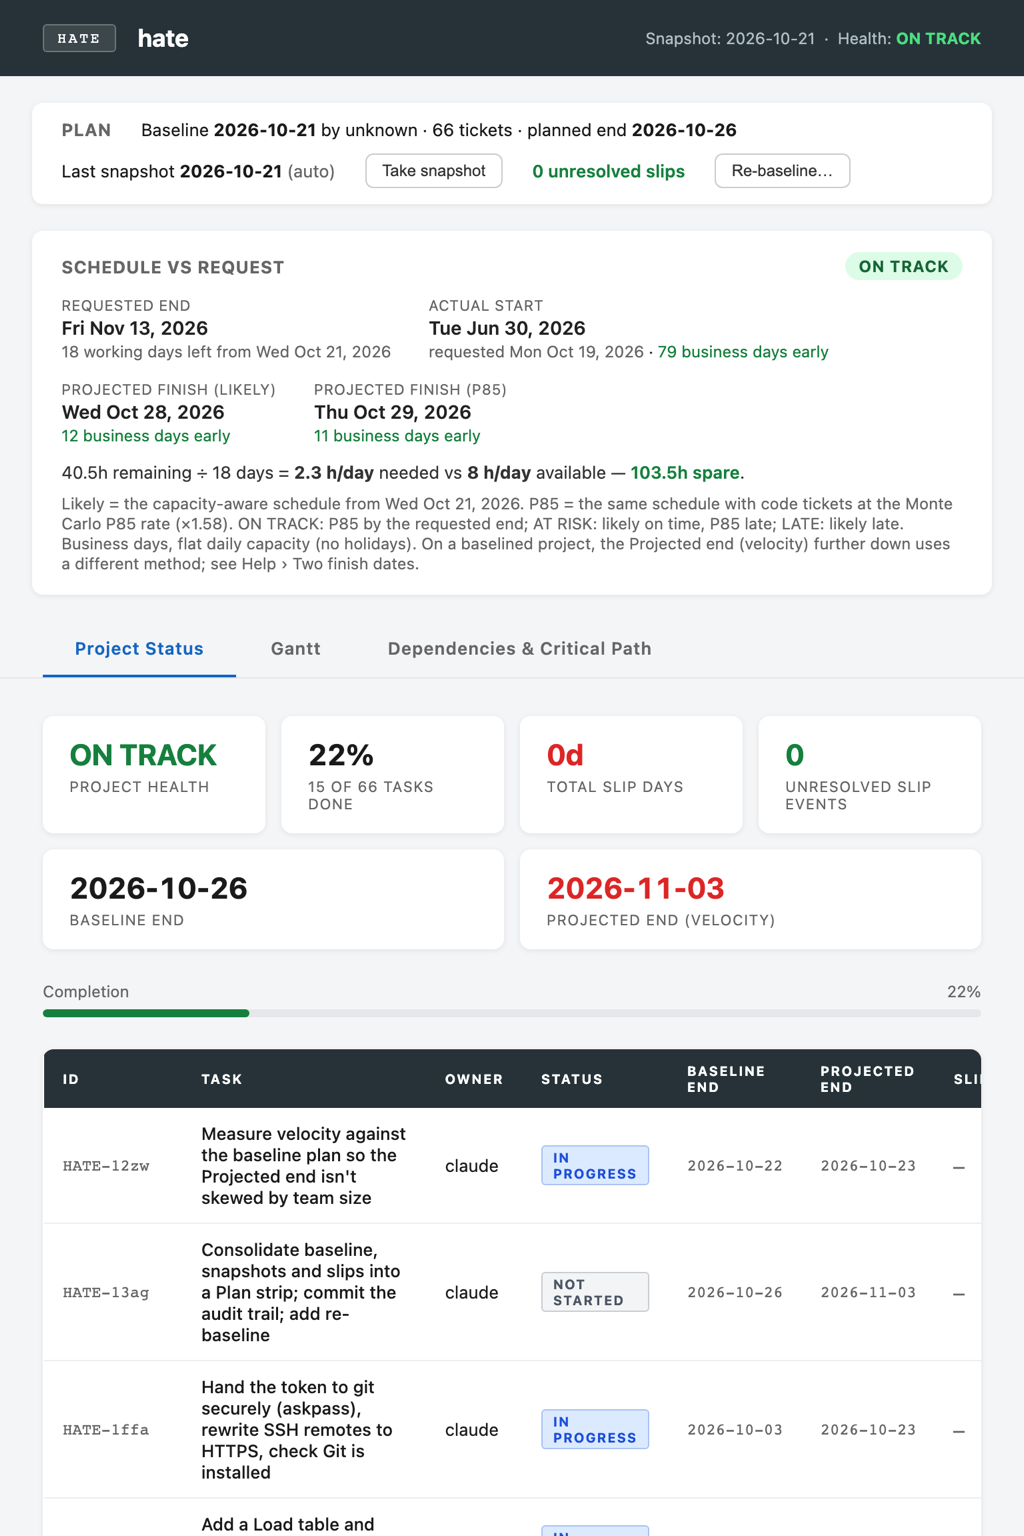
Why: while writing the Help text we found that the velocity behind Projected end was biased, and the bias depended on the team, not on progress. It divided planned business days of finished work by calendar days since the baseline started:
- One person exactly on plan read about 0.71, because weekends count against you. Every remaining task got stretched about 1.4x, which was too pessimistic.
- Three people working in parallel on plan read about 2, because their planned days were summed. Every remaining task got roughly halved, which was too optimistic.
What: velocity is now planned days finished ÷ planned days the baseline had finishing by today (earned-schedule style). On plan is 1.0 for any team size. Half of what was due being done reads 0.5, and ahead of plan reads above 1. Tests cover parallel teams, weekends, behind, ahead and nothing-due-yet. The 3-person case read 1.76 under the old formula.
Part 2: How hate estimates, and the two finish dates
Two questions, two dates
A baselined dashboard shows two finish dates because it answers two different questions:
| Projected finish (likely / P85) | Projected end (velocity) | |
|---|---|---|
| Where | Schedule vs request card | Summary card + task table |
| Question | Given the people and the hours left, when do we finish? | At the pace we’ve finished work so far, when do we finish? |
| Inputs | Remaining estimated hours, each person’s daily hours, dependencies | Baseline plan, which tasks are done |
| Knows about people? | Yes: two people with 40 h each finish sooner than one with 80 h | No |
| Knows the pace so far? | No | Yes |
| Uncertainty | P85 adds it, via Monte Carlo | None: one date |
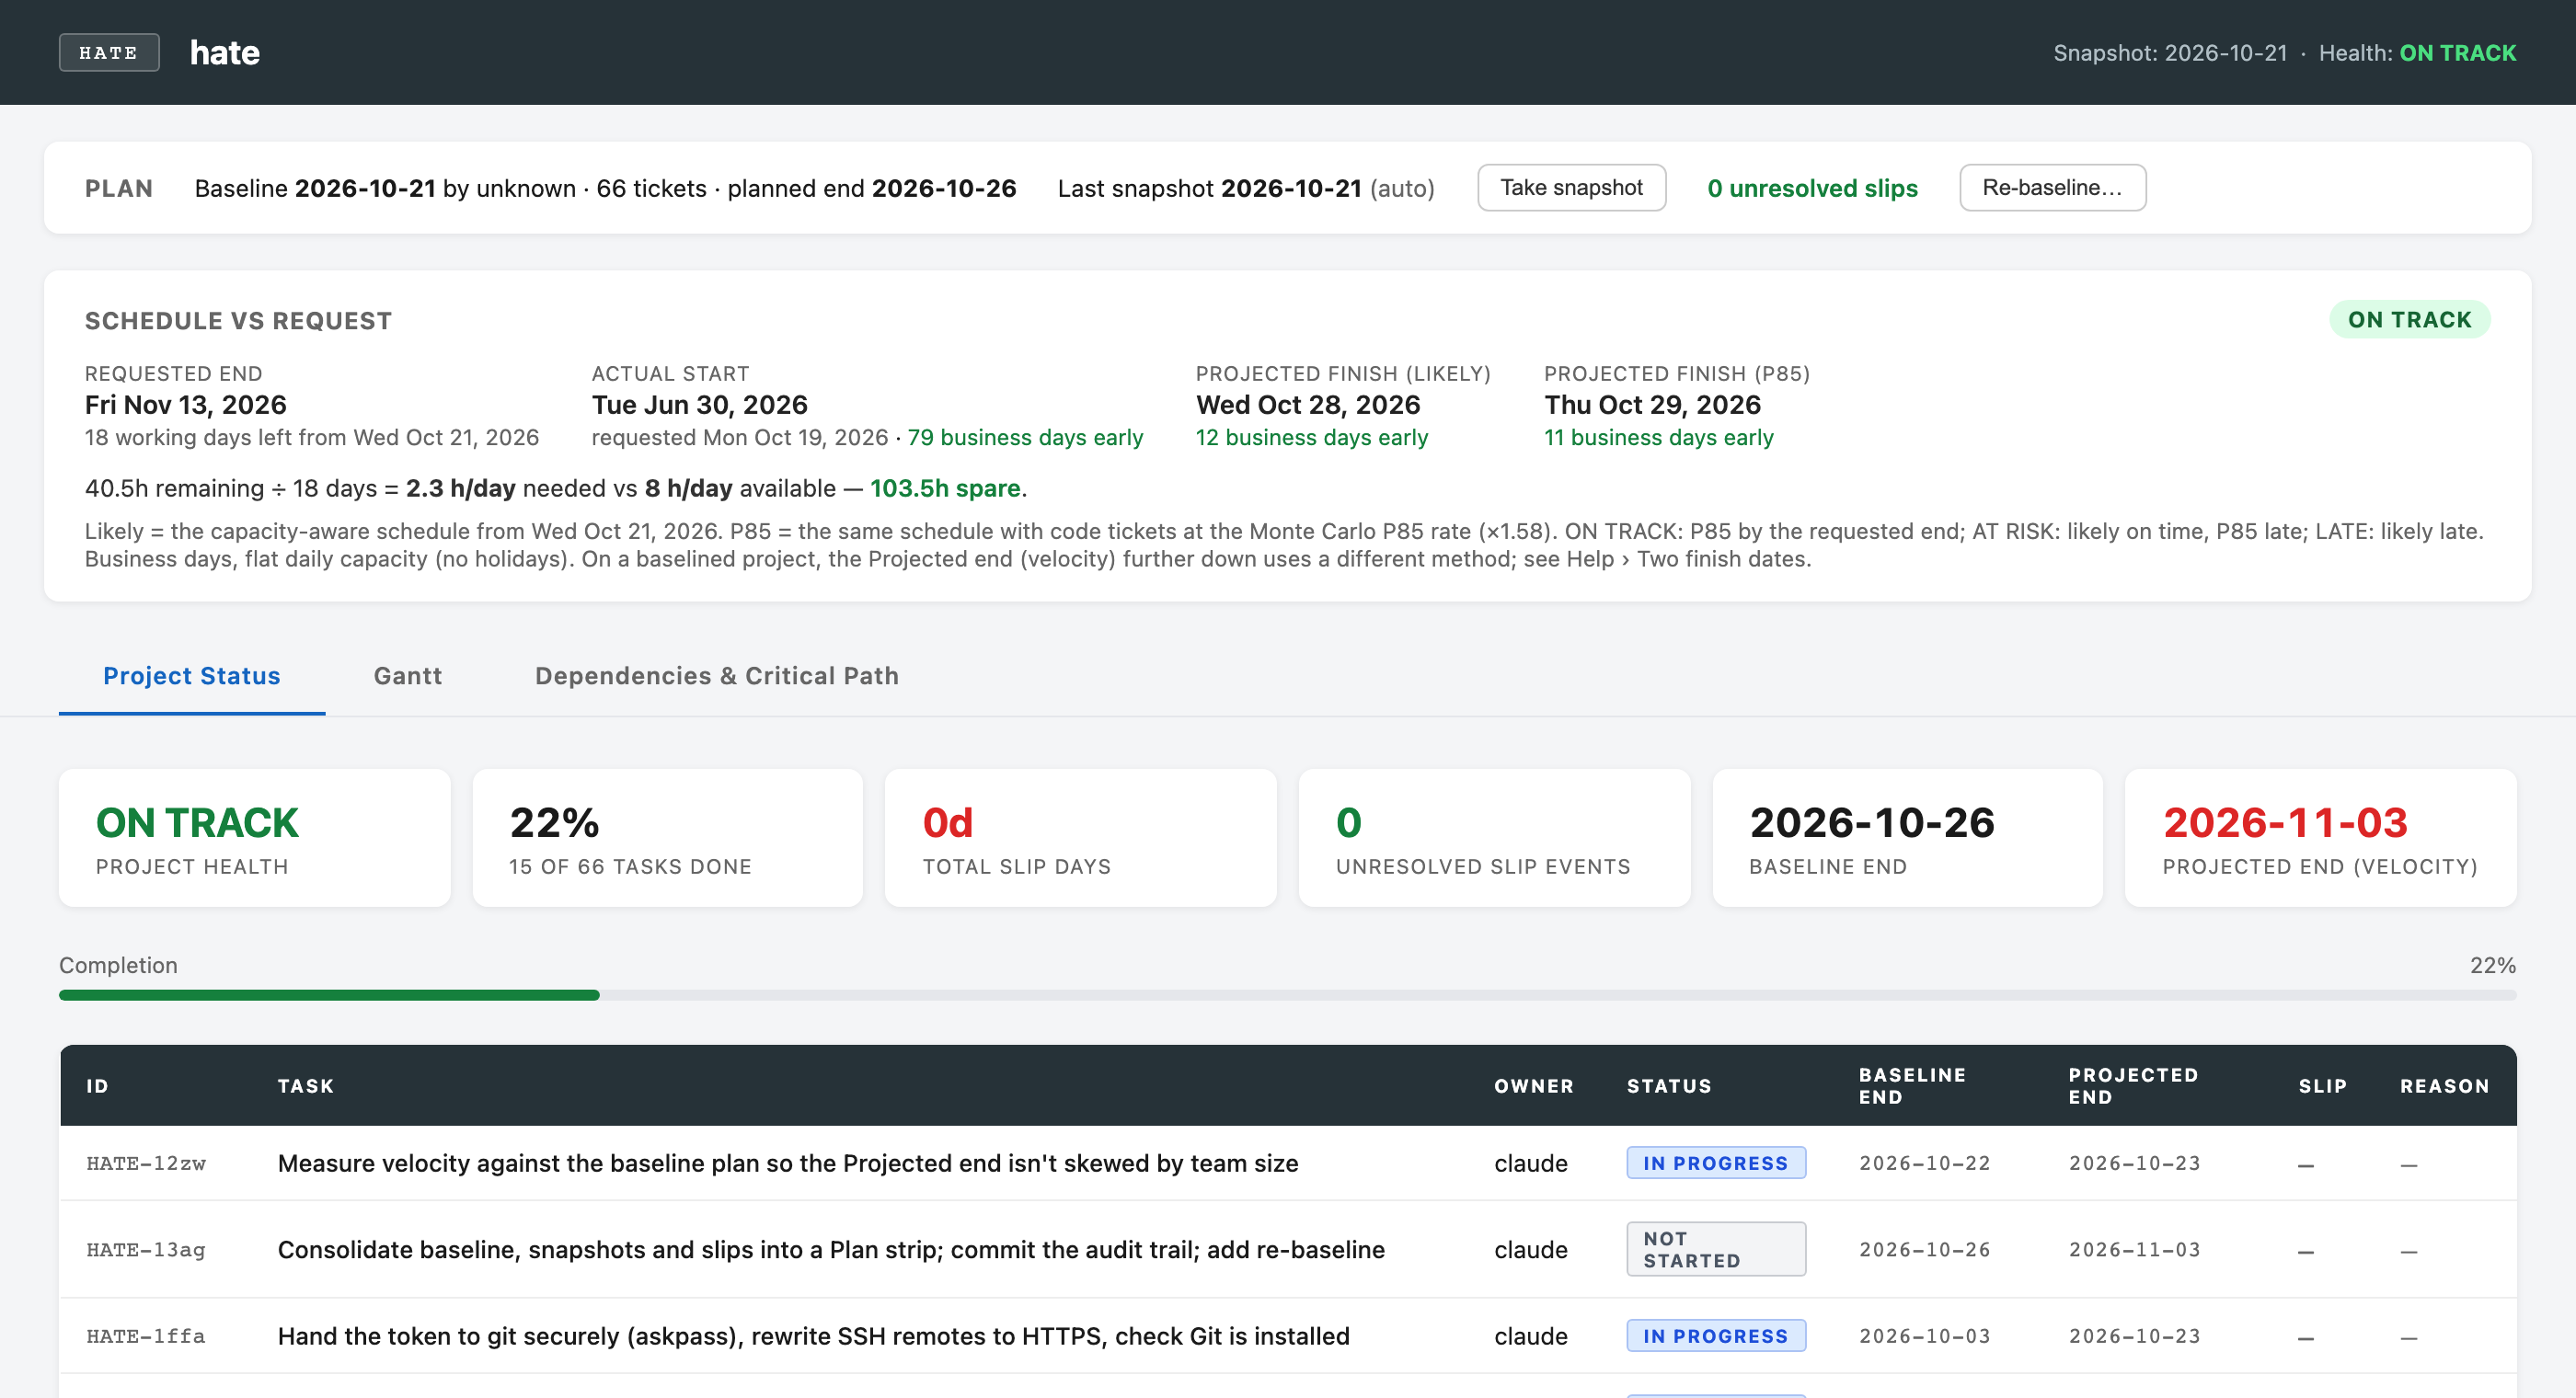
A baselined dashboard showing both: likely Oct 28 and P85 Oct 29 on the card, velocity Nov 3 below
In this example, the capacity view says Oct 28 (likely) or Oct 29 (P85): there are 40.5 hours left and plenty of people-hours to do them. The velocity view says Nov 3, because several tasks the baseline had finishing by now aren’t done. Neither date is wrong. Together they say: the hours fit, but we’ve been finishing slower than planned. Check whether those tickets are really unfinished or just not promoted.
How to read a gap:
- Velocity later than likely: work is finishing slower than planned, or finished tickets haven’t been promoted. Check for stale tickets first. If the slow pace is real, the remaining estimates are probably low too.
- Likely later than velocity: the pace looks fine, but the hours left don’t fit the people available. The Load table shows who is overloaded.
- Which to use: commit to clients on P85. Use velocity as the reality check on the plan.
Monte Carlo, in plain language
Any single estimate is a guess, and a guess hides how uncertain it is. Monte Carlo replaces the one guess with 10,000 simulated projects and looks at the spread.
What goes in:
- Size: each feature’s COSMIC function points (CFP), from the
cfp:tag on the feature’s parent ticket. - Reference rates, in hours per CFP: how fast comparable finished features actually went. These come from any mix of past projects you pick, this project’s own finished features (half the weight at 5 done, all of it from 15), and a manual Low / Likely / High range for a cold start.
- Platform wrap: the hours on config and non-functional tickets (console setup, deploys, smoke tests). Done ones count their actual hours, the rest their
estimate_hours. This part is fixed, not simulated.
One simulated run:
- For every feature, pick a rate at random from the reference rates. Most picks land near the typical rate, and now and then one is slow, like real work. (Technically: a log-normal fitted to the reference rates, with the spread widened 1.5x, because backtesting showed the raw spread was too narrow.)
- That feature’s code hours = CFP × the rate.
- Add up all features. If you set a counting uncertainty (say ±20% for a rough CFP count), nudge the sum by a random amount within it.
- Add the fixed platform wrap. That’s one possible total for the project.
Repeat 10,000 times and sort the totals from smallest to largest:
- P50, the middle total: half the runs needed less, half more. A coin flip. Commit to P50 and you’ll be late about half the time.
- P85: 85 of every 100 runs came in at or under it. Roughly an 85% chance of finishing within it, about 1 in 7 of running over. This is the number to commit to.
- P95: about a 1-in-20 chance of running over. Use it when being late is expensive.
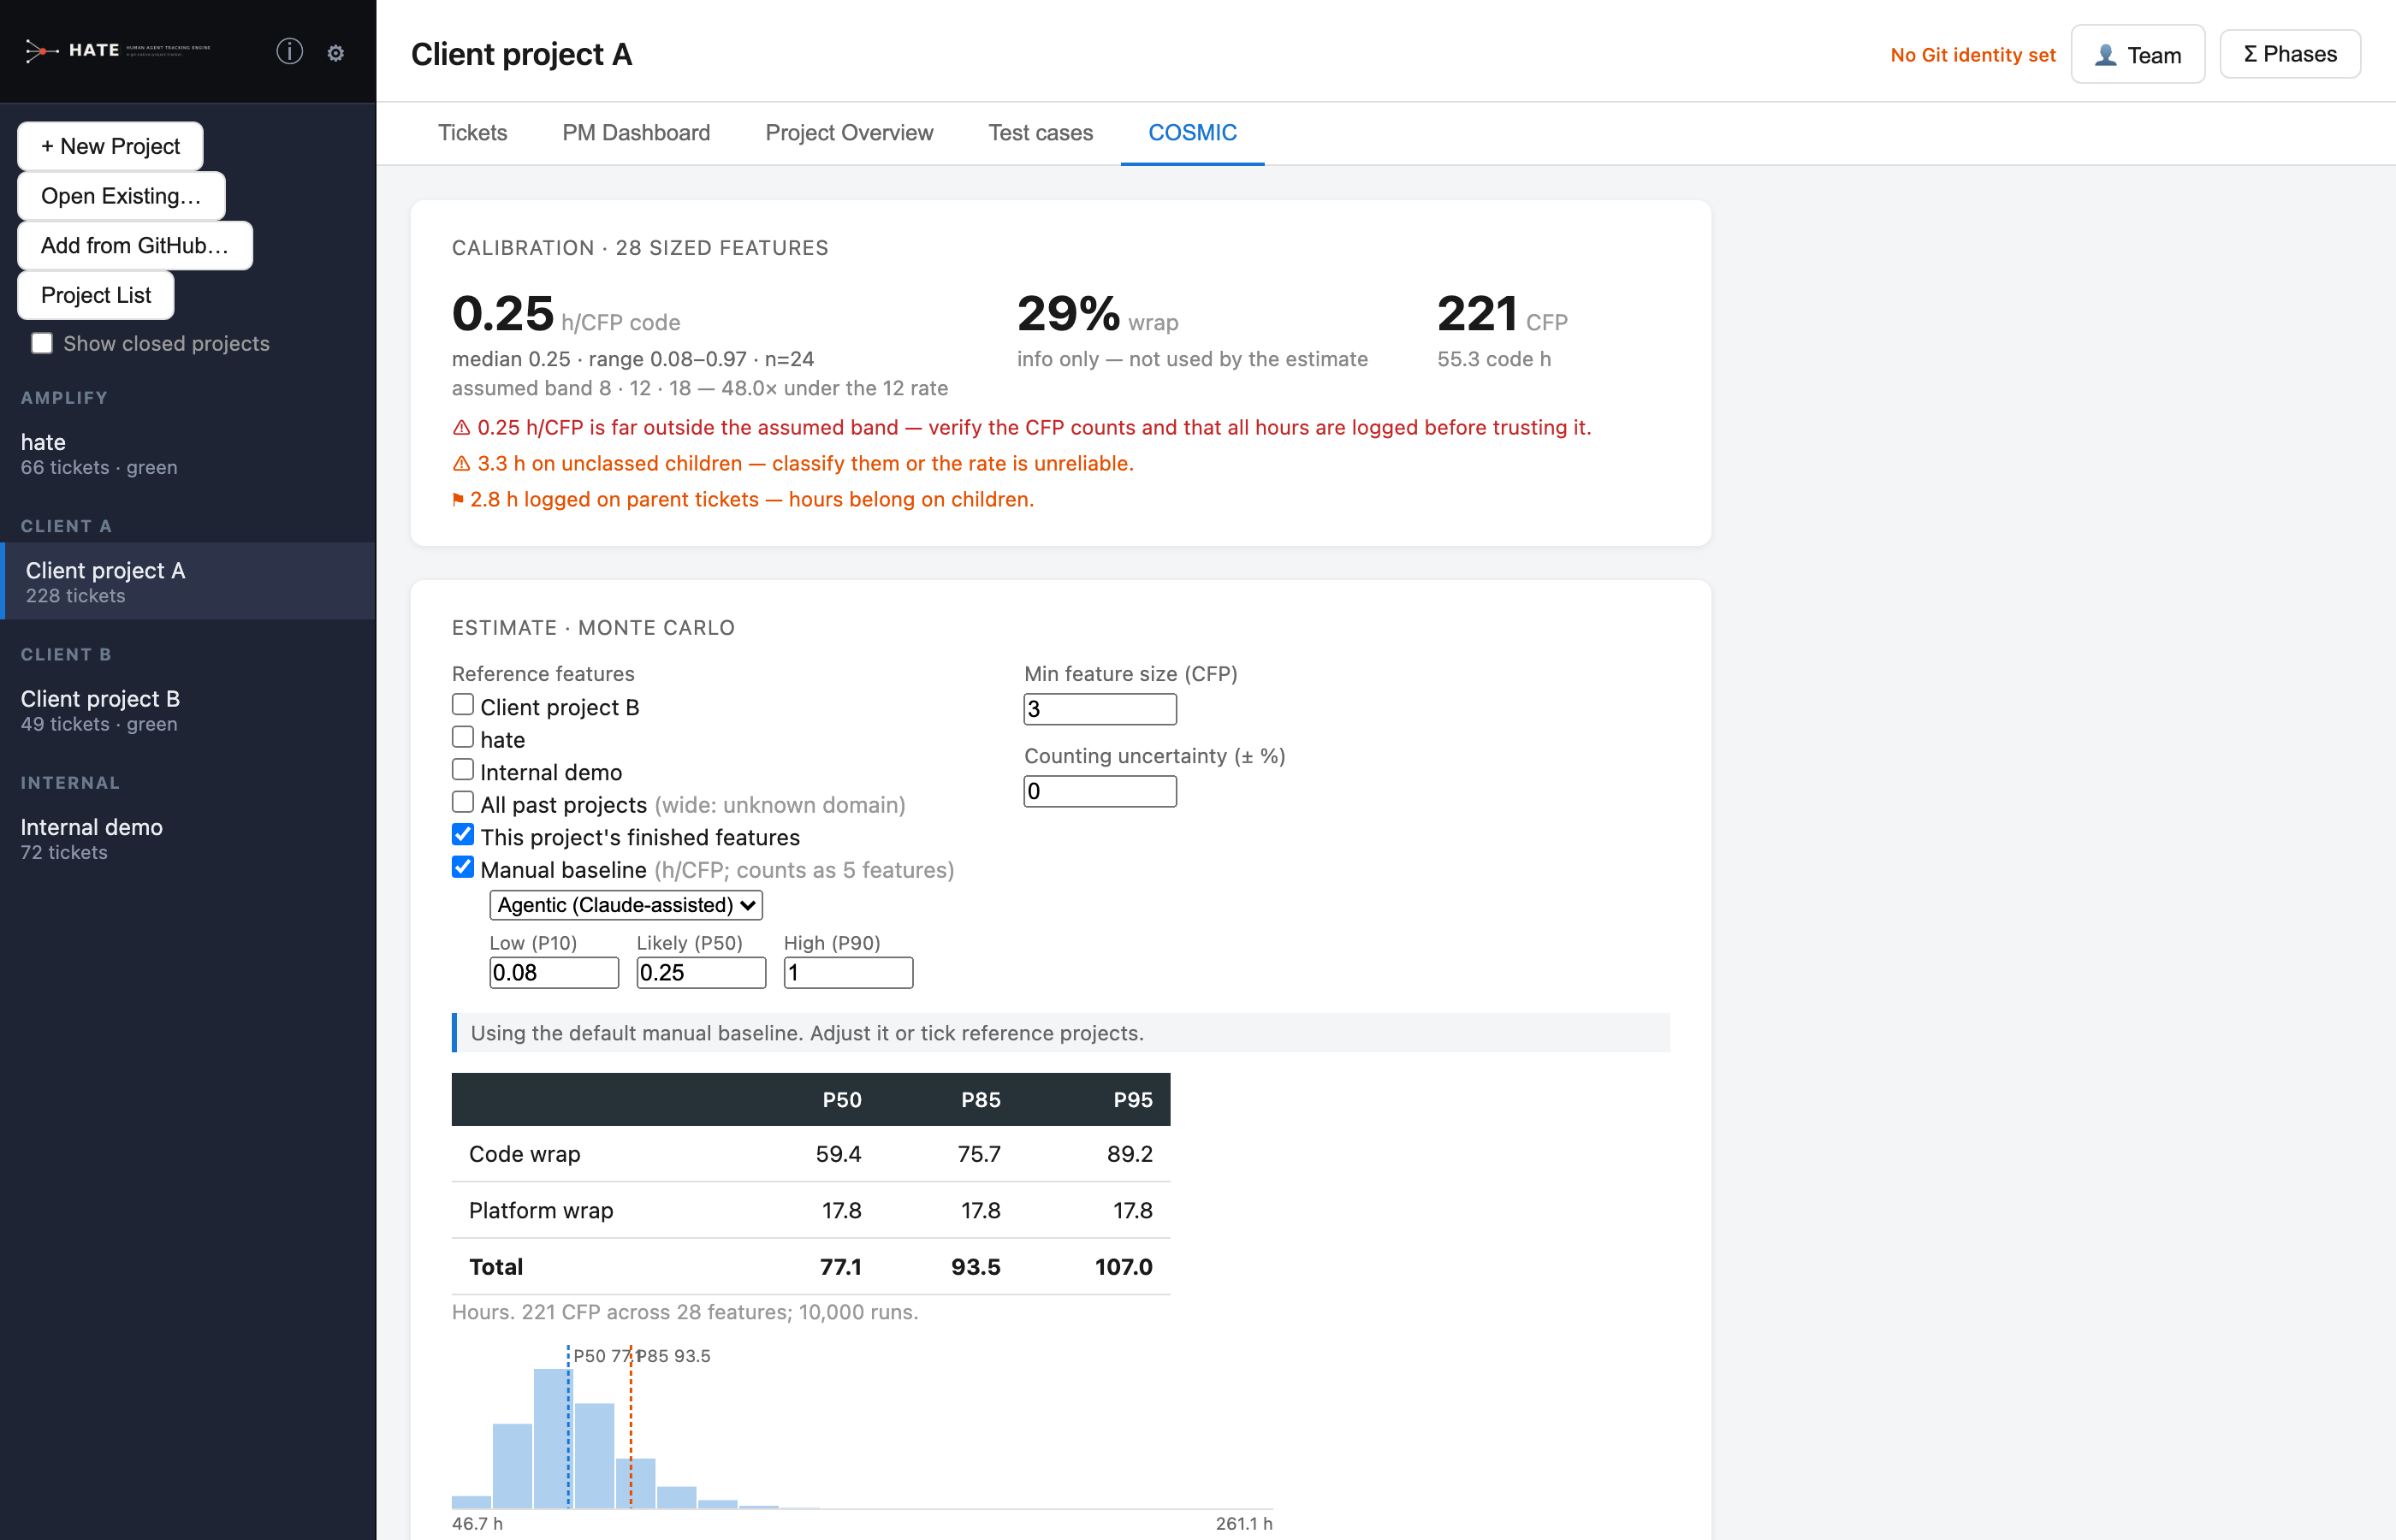
The COSMIC tab on a client project (anonymized as Client project A): calibration, the Monte Carlo estimate and its histogram
A real example (Client project A, above; client names are anonymized throughout): 28 features, 221 CFP. Its own finished features run a median of 0.25 h/CFP (range 0.08 to 0.97, from 24 features), blended with the default “Agentic” manual baseline (0.08 / 0.25 / 1.00). The simulation gives:
| P50 | P85 | P95 | |
|---|---|---|---|
| Code wrap | 59.4 h | 75.7 h | 89.2 h |
| Platform wrap | 17.8 h | 17.8 h | 17.8 h |
| Total | 77.1 h | 93.5 h | 107.0 h |
The histogram shows why one number isn’t enough. Most runs bunch around 70 to 80 hours, but there is a long tail to the right, out past 200 hours in rare runs. That tail is the real risk of a few features turning out slow, and P85 prices some of it in. Platform wrap is the same in every column because it isn’t simulated.
How P85 becomes a date
The COSMIC tab gives hours. The Schedule vs request card turns them into dates:
- Likely finish: schedule all remaining work. Each person gets their tickets in dependency order at their daily hours, and the last ticket’s end is the date.
- P85 finish: take the ratio code P85 ÷ code P50 (for Client project A, 75.7 ÷ 59.4 ≈ 1.27; for the example dashboard above, ×1.58), multiply every code ticket’s hours by it, and run the same schedule again.
So “P85 finish: Oct 29” reads as “about an 85% chance we’re done by Oct 29, if the team, the scope and the wrap estimates hold.” The status follows from it:
- ON TRACK: P85 is on or before the requested end.
- AT RISK: likely is on time, but P85 is late.
- LATE: even likely is late.
What the simulation doesn’t know
- It’s only as good as its references. If you pick past projects unlike this one, the range is confidently wrong. Choose comparable projects, or use “All past projects” for a deliberately wide range.
- Wrap isn’t varied. A bad
estimate_hourson a config ticket passes straight through. - No calendar events. Holidays, sick days, people joining or leaving, and scope added later aren’t modeled. Add the tickets and the numbers update.
- The P85 date is approximate. Scaling code hours by one ratio and re-scheduling is a good approximation of a per-run date simulation, not the same thing.
- The numbers are stable. The random seed is fixed, so reloading doesn’t change them. They move only when tickets, hours or references change, which is what you want when you’re watching a trend.
Loose ends found while writing this
The screenshots turned up three small issues. None has a ticket yet:
- An early finish shows in red. On a completed client project (Client project B), Projected end (velocity) is 2026-04-30 against a 2026-06-30 baseline, two months early, but it’s colored red. The color only checks “different from baseline”, not “later”.
- The Export to Excel button wraps onto three lines on a 1400 px window when every filter is shown. It’s cosmetic.
- Export right after a baseline uses the projection. The workbook’s Gantt says “Projected … not baselined” until the first snapshot after a baseline is taken (opening the dashboard takes it).
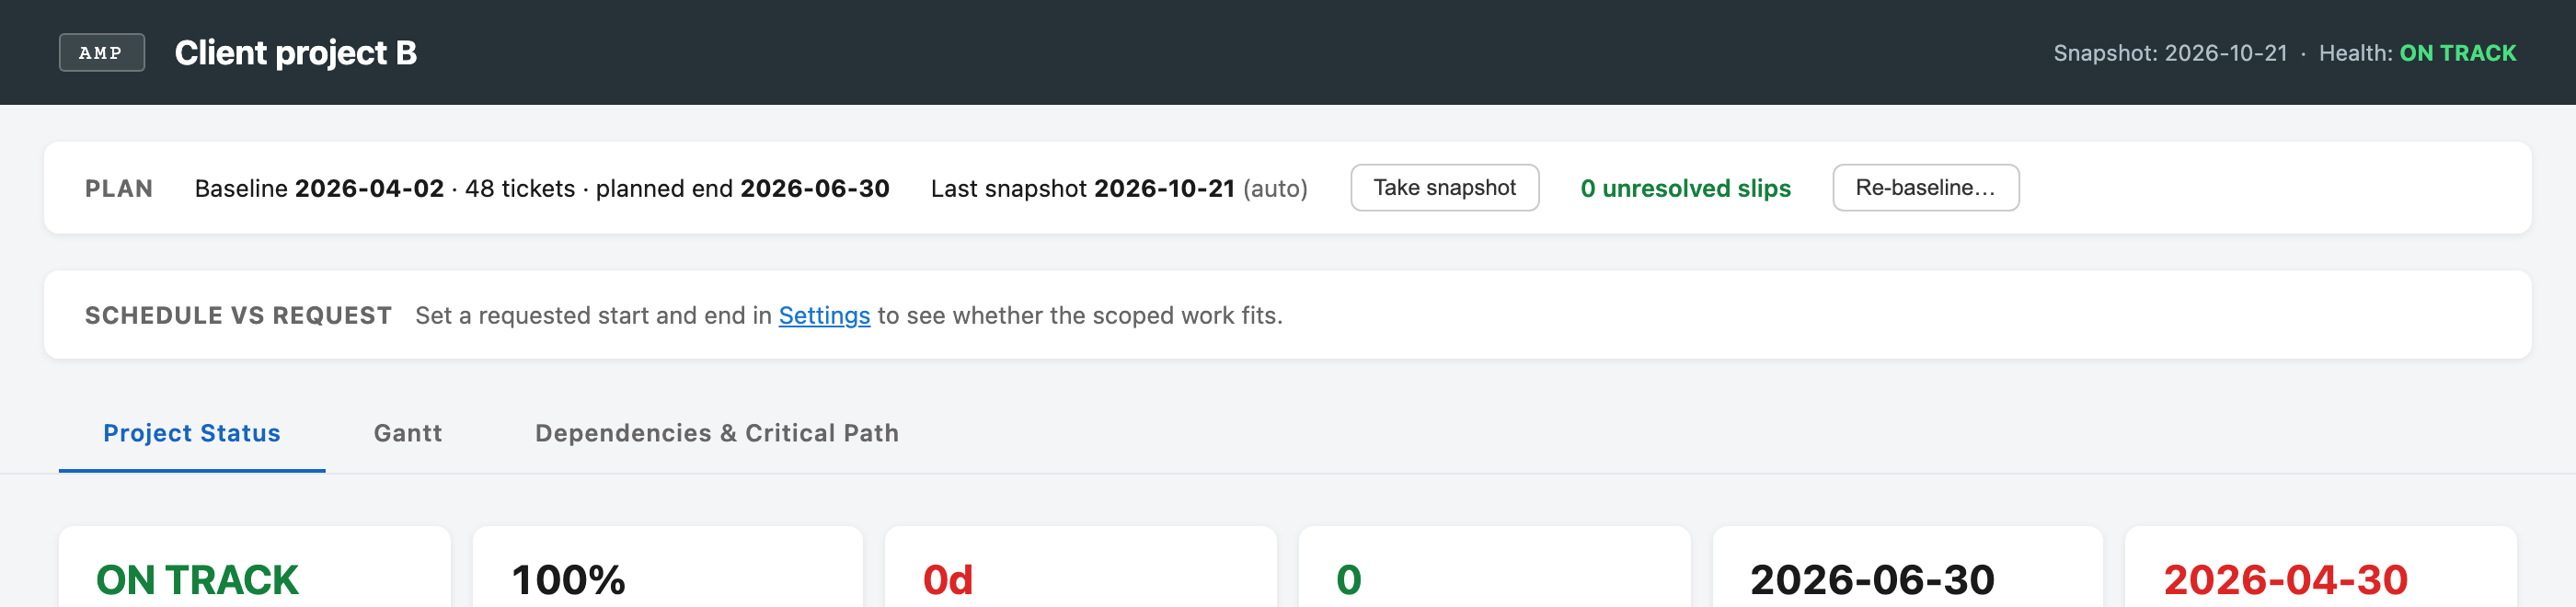
A completed, baselined project: the early finish shown in red
Release summary
| Version | Change |
|---|---|
| 1.0.12 | Excel export (Tickets + Gantt sheets); two-column ticket modal; promote/demote target labels and status path strip; one light PM dashboard theme |
| 1.0.13 | Status endpoints accept the author in the URL or body; readable green on the pre-baseline Complete card |
| 1.0.14 | Filter dropdowns keep every option after filtering |
| 1.0.15 | Tickets show even when index.json can’t be written; edits no longer return 500 or skip their commit on Windows |
| 1.0.16 | Help: two finish dates and Monte Carlo in plain language; “Projected end (velocity)” label |
| 1.0.17 | Velocity measured against the baseline plan, so it no longer depends on team size |