
Introduction
AI has arrived, and it is everywhere. It writes code, drafts documents, summarizes meetings, triages tickets and answers questions across nearly every industry and function you can name. With that ubiquity has come a steady drumbeat of claims about productivity. Engineers ship faster. Teams do more with less. Whole categories of work compress from days into minutes.
The trouble is that almost none of these claims survive much scrutiny. Ask how the gain was measured and you usually get one of three answers: a self-reported survey, a count of suggestions accepted in an IDE or a before-and-after anecdote with no control. None of these tells you what you actually want to know, which is whether more useful software is getting built per unit of effort and, if so, by how much.
This article is about how to measure that properly. The goal is not to settle the question of whether AI improves software productivity. The goal is to lay out a measurement approach that can answer the question honestly for any given team, tool or workflow, with numbers that mean the same thing tomorrow as they do today.
To do that we need a unit of output that does not depend on the technology used to produce it, and a baseline rate of effort against that unit. Both already exist. They come from a body of work that predates the current AI wave by several decades and was originally built to solve a different but related problem: how to estimate and compare software projects across organizations, languages and methodologies in a uniform way.
That body of work centers on a measurement called the COSMIC function point. Before getting into how it applies to AI productivity, a quick recap.
COSMIC Function Points: A Quick Primer
COSMIC function points (CFP) are a way to measure the functional size of software based on what it actually does with data, not how it is built. The method is standardized as ISO/IEC 19761 and was designed to work across business, real-time, and infrastructure software without favoring any one style.
The core idea is simple. Software exists to move data. Every piece of functionality, no matter how it is implemented, can be decomposed into four types of data movement:
- Entry (E): data crosses into the software from a functional user (a person, a device or another piece of software)
- Exit (X): data crosses out of the software to a functional user
- Read (R): data is retrieved from persistent storage
- Write (W): data is sent to persistent storage
Each data movement counts as one COSMIC Function Point (1 CFP). There are no weightings, no complexity adjustments, no subjective ratings. You identify the functional processes, count the movements, and add them up.
A Trivial Example: Look Up a Customer
A user enters a customer ID and the system returns the customer’s name and address.
| Movement | Type | CFP |
|---|---|---|
| User submits customer ID | Entry | 1 |
| System reads customer record | Read | 1 |
| System returns name and address | Exit | 1 |
Total: 3 CFP
A Slightly Less Trivial Example: Update a Customer’s Email
A user submits a customer ID and a new email address. The system updates the record and confirms success or reports an error.
| Movement | Type | CFP |
|---|---|---|
| User submits ID and new email | Entry | 1 |
| System reads existing customer record | Read | 1 |
| System writes updated record | Write | 1 |
| System returns confirmation or error | Exit | 1 |
Total: 4 CFP
Why This Matters
Because CFP counts what the software does for its users rather than how much code was written to do it, the same functional requirement has the same size regardless of language, framework or developer. That property is what makes CFP useful as a denominator when you want to measure productivity, effort or, as we will get into, efficiency gains from AI-assisted development.
What a Function Point Costs in Practice
Counting function points is only half of the equation. To turn a size measurement into something useful for planning, estimation or comparison, you need to know how much effort a function point typically takes to deliver. The industry’s longest-running source for this kind of data is the International Software Benchmarking Standards Group (ISBSG), which maintains a repository of thousands of completed projects with their measured size, effort and delivery characteristics.
The metric that matters here is the Project Delivery Rate, or PDR, expressed in hours per function point. For COSMIC-measured projects in the ISBSG repository, the PDR covers everything from requirements capture through user acceptance testing and includes the effort of developers, testers, project managers and supporting roles. It is a full lifecycle number, not just coding time.
Drawing on ISBSG benchmark data and the practitioner literature that builds on it, the typical ranges for COSMIC PDR look like this:
| Percentile | Hours per CFP |
|---|---|
| Lower bound (efficient projects) | ~8 |
| Median | ~12 |
| Upper bound (typical for larger or more complex projects) | ~20 |
In other words, a feature sized at 10 CFP would, under normal conditions, take somewhere between 80 and 200 hours to deliver end to end, with 120 hours being a reasonable central estimate.
A few things are worth pulling out of this.
First, the spread is wide but bounded. A 2.5x difference between the lower and upper bounds is large enough to matter for any individual project, but it is small enough that the median is a defensible planning anchor when you do not have organization-specific data. Teams that have been counting their own work for a while almost always converge to a tighter, internally-consistent rate that sits somewhere inside this range.
Second, these numbers include all the work, not just typing code. Requirements, design, review, testing, fixing, deployment prep and coordination are all in there. This is exactly why the rate is useful as a baseline. If you only measure the time a developer spends writing code, you systematically undercount the cost of delivering software, and you will dramatically overstate any apparent efficiency gain from a tool that only accelerates the typing.
Third, the rate is denominated in functional output, not in effort or lines of code. That is the property that makes it survive across languages, frameworks and team structures. A 10 CFP feature is a 10 CFP feature whether it is implemented in COBOL, TypeScript or a low-code platform. The PDR may differ across those environments, but the size of what was delivered does not.
This last point is what sets up the rest of the article. Once you have a stable, technology-independent measure of output (CFP) and a defensible baseline for effort (PDR in hours per CFP), you have the two ingredients you need to ask a much harder question: when an AI tool changes the way software gets built, what exactly changed, and by how much?
From Measurement to Practice
Knowing that COSMIC function points exist, and knowing what a function point typically costs, is not the same as being able to use them. To actually measure AI productivity on real work, you need somewhere to record the size of what was built, somewhere to record the effort it took, and a way to do both at the pace that modern development actually moves. That last part is where most existing tooling falls down.
In a previous article I introduced a small open source tool I built called hate. It is a git-based ticket tracking system, and the reason it exists is straightforward: the tools we already have were not designed for the speed at which agentic development happens. When four agents are working on six different parts of the same codebase, opening tickets, updating their status, running tests, marking work as ready for review and promoting it through phases, a ticketing system that lives behind a web UI and an API rate limit is the wrong shape. Tickets need to live next to the code, move at the speed of a commit and be edited by whatever is doing the work, whether that is a human or an agent.
hate solves that by storing tickets as files in the repository. Agents (and people) read and update them the same way they read and update any other file. When the work is committed, the ticket state is committed with it. There is no separate system to keep in sync, no API to call, no eventual consistency between what the code says and what the tracker says. The git history is the audit log.
That property turns out to matter for measurement too. If we want to track how much functional output a piece of work produced, the natural place to record it is on the ticket that scoped the work in the first place. And if the ticket lives in the repo, the size measurement lives in the repo, alongside the diff that delivered it.
So I have extended hate to bake COSMIC function points in directly. Tickets now carry a CFP count as part of their structure, captured at the point the work is scoped and refined as the work is understood. That gives us a per-ticket size measurement that travels with the code, accumulates over time and can be sliced any way we need to answer the productivity question.
The next sections walk through how that actually works: how CFP gets captured on a ticket, how the count is validated, and how the resulting data feeds into the calibration and comparison we need to measure AI productivity in a defensible way.
Counting Function Points Without a Counter
Historically, COSMIC function point analysis has been done by a person. A trained counter sits down with the requirements, works through each functional process, identifies the data movements one by one and classifies each as an Entry, Exit, Read or Write. It is rigorous and it is repeatable in theory, but in practice it is also slow, expensive and rarely done. Most teams that would benefit from function point counting do not do it, because the cost of doing it manually does not fit inside the cadence of how they actually ship.
This is one of those places where an LLM turns out to be unreasonably well suited to the task. Counting function points is exactly the kind of work that humans find tedious and that a model finds trivial: read a structured description of what the software needs to do, apply a small set of well-defined classification rules and produce a tally. The rules of COSMIC are explicit. The inputs are text. The output is a number. There is very little room for the model to wander.
The workflow I use looks like this. I take a piece of work that needs to get done, usually something fairly large, and I hand it to Claude Code with a single instruction: break this into phases, create tickets for each phase and count the COSMIC function points on each ticket. The CLAUDE.md for the repository spells out the counting rules, the ticket format hate expects and the constraint that nothing gets written to the ticketing system until I have reviewed it.
What comes back is typically six or so phases, each containing somewhere between four and ten tickets, with a CFP count attached to every ticket. A phase is just a named block of related work that makes sense to ship together. The whole exercise takes minutes, not the hours or days a manual count of the same scope would take.
Two things about this are worth calling out.
The first is speed. The reason teams do not count function points is almost always cost. Removing the cost changes the calculus entirely. When a count takes minutes, you can do it on every piece of work, and you can redo it when the scope changes, which is exactly what you need for the count to be useful as a measurement rather than a one-time estimating exercise.
The second is consistency. A human counter, even a good one, drifts. The same person looking at the same requirement on two different days will sometimes classify a borderline data movement differently the second time. I do this myself when I count by hand. Was that one Read or two? Is the confirmation message an Exit, or is it part of the same Exit as the result? The answers are not always obvious, and the answer I give depends partly on how tired I am. A model applying a fixed set of rules from a CLAUDE.md does not have that problem. Its answers may not always be the ones a certified counter would give, but they will be the same answers every time, which is the property that actually matters when you are using the counts to compare work across time or across teams.
That second point is worth dwelling on. For productivity measurement, internal consistency matters more than absolute correctness. If your counts are systematically off by 10% but they are off by 10% in the same direction every time, your trend lines and your comparisons are still valid. If your counts are perfectly correct on average but vary unpredictably by 30% between counters or between Tuesdays and Thursdays, you cannot trust anything you derive from them. The model gives up a little of the first kind of accuracy in exchange for a lot of the second, and for what we are trying to do here that is the right trade.
What Three Projects of Real Data Showed
To date I have taken three projects end to end by myself, using hate for ticket tracking and CFP analysis to measure the work along the way. This is where the picture stops being theoretical and starts getting interesting.
The headline you see everywhere right now is that the cost of writing code has collapsed to zero. There is something true about this. If I sit down to write a recursive algorithm from scratch, something I do not have occasion to write often enough to have it cached in muscle memory, it might take me three hours. Claude will produce the same algorithm in five different languages, simultaneously, in less than a minute. Not faster. Not a little faster. A different order of magnitude, in a different unit of time.
If that were the whole story, productivity measurement would be easy. Multiply by some factor, declare victory, move on. The reason this article exists is that it is not the whole story, and the CFP-per-hour numbers from these three projects make that very clear.
When you actually look at the numbers, this is where the standard measurement framework breaks.
The hate tool, by default, flags any hours-per-CFP figure that falls outside the industry sane band of roughly 8 (low), 12 (median) and 18 (high). Those are the numbers from the standards body, and they are the rates the rest of the industry has built its estimation models around for decades. If a project comes in at 6 hours per CFP, that is notable. If it comes in at 25, that is notable. Anything in between is normal.
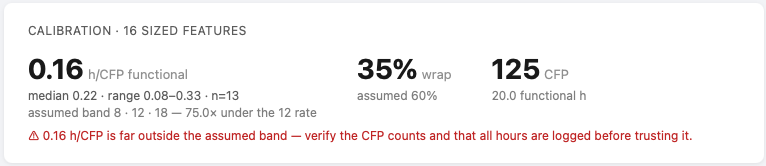
The screenshot above is from one of the three projects. The reported figure is 0.16 hours per CFP. The tool flags it in red because it is an error, or at least because nothing the tool was designed around says a number that small is possible.
0.16 hours is about ten minutes. Ten minutes per COSMIC function point. Against an industry median of twelve hours per CFP, that is roughly seventy times faster. Against the low end of the sane band it is fifty times faster. Against the high end, well over a hundred. Pick whichever multiplier you find least uncomfortable and it is still in a range that should not exist according to any baseline we have.
The temptation is to dismiss this as a measurement artifact. Counts must be too low. Effort must be undercounted. Something must be wrong with the data. But the counts were produced by the same model applying the same rules to every ticket across all three projects, and the effort numbers are wall-clock time on work I did myself. The counts are internally consistent and the hours are real. The number is what it is.
What the number actually says is that the framework the industry uses to estimate and benchmark software development was calibrated against a world in which a human writes the code. In that world, eight to eighteen hours per function point is a defensible range because the activity at the center of the work, translating a specified data movement into working code, has a roughly stable cost per unit. Agentic coding does not just compress that activity. It removes it from the critical path. The cost of producing the code is no longer the thing that determines how long a function point takes to deliver.
Wrap: The Hours That Do Not Disappear
If the cost of producing functional code collapses, the obvious next question is what is left. Software is not just functional code. There is platform setup, infrastructure standing up, performance tuning, security hardening, load testing and a long tail of work that does not show up as a data movement on a ticket but absolutely shows up on the clock. CFP does not measure any of it, and that is by design. CFP measures functional size. Everything else is something else.
hate captures this with a metric called wrap. Wrap is the share of effort that goes into work around the functional code, expressed as a percentage of the functional hours. Every ticket carries a class tag that puts its logged time into one of three buckets:
- functional: work that delivers actual functional data movements, the part COSMIC sizes in CFP
- config: platform and managed-service setup, things like standing up a Bedrock knowledge base. Real effort, 0 CFP
- nonfunc: non-functional work like performance, security, hardening and load tests. Also 0 CFP
The formula is:
wrap % = (config hours + nonfunc hours) ÷ functional hours × 100
So wrap answers a single question: for every hour of functional code, how much extra time went into the surrounding config and non-functional work?
A wrap of 60% means that for every ten hours of functional work, another six went into platform and non-functional work. A wrap of 0% means every logged hour was functional. The value is blank when a feature has no functional hours logged yet, because you cannot divide by zero.
Why does this matter? The COSMIC view in hate is trying to do something specific: replace two borrowed industry assumptions with your own measured numbers. The defaults baked in are the 8 / 12 / 18 hours-per-CFP band and a 60% wrap, both of which come from the standards body and the broader practitioner literature. They are reasonable defaults when you have nothing else. They are the wrong numbers to plan against once you have your own data.
As tickets close and hours accumulate, the dashboard surfaces the empirical wrap from your delivered work. You stop estimating with the generic 60% and start using what your projects actually cost. That matters in a normal-development context, but it matters more in an agentic one, because the two halves of the ratio do not scale together when AI enters the picture.
Functional code production is the part agentic coding accelerates the most. The config and non-functional work, by and large, does not collapse the same way. A Bedrock knowledge base still takes whatever it takes to stand up. Load tests still take whatever they take to run. Security review is still security review. When the denominator of the wrap calculation shrinks by a factor of fifty and the numerator does not, the ratio explodes.
This is why the 0.16 hours per CFP number from the previous section is only half the story. Behind it is a wrap percentage that no longer means what it used to mean, and a cost structure that has inverted from what the industry baseline assumes. Most of the effort in an AI-assisted project is no longer the functional code. It is everything around it.
What This Tells Us
A few things fall out of the data, some of which are about AI and some of which are about how we measure work in the first place.
The first conclusion is the obvious one. LLMs produce code at a rate that is not in the same league as a human, and the cost of producing functional code has effectively collapsed to near zero. The 0.16 hours per CFP number is not a clever trick or a measurement glitch. It is what happens when the activity that used to dominate the delivery curve gets removed from the critical path. Anyone planning, estimating or budgeting software work against the old hours-per-CFP baseline is now planning against a number that no longer describes the world they are working in.
The second conclusion is about wrap. If functional code production collapses and config and non-functional work does not, the cost of software does not go to zero. It redistributes. The shape of a project changes. Most of the hours in an AI-assisted project are no longer in the code. They are in everything around the code: platform setup, integration, hardening, testing, deployment and the surrounding context that a model cannot just generate its way through. Planning a project against the old wrap percentage will mislead you in exactly the opposite direction from how the hours-per-CFP number misleads you. One number is now far too high. The other is now far too low. Both need to be re-anchored against measured data.
The third conclusion is methodological, and for me it is the most interesting one. This whole exercise validates the approach behind hate, which is that tickets should be the first-class source of truth for what was built and what it cost. The traditional alternative is a project manager chasing people around asking them how long things took, retroactively, from memory, days or weeks after the fact. That approach produces estimates with all the precision of a guess and all the authority of a spreadsheet, which is to say not much of either.
When tickets are the deliverable, when they live in the repo next to the code, when developers (and agents) are required to record what was done and how long it took, you get something the industry has been missing for a long time: a self-calibrating productivity model that uses your own data instead of someone else’s.
Concretely, this means that after a couple of projects of the same shape, you know what that shape actually costs. If you build IVRs on Amazon Connect, you do not need to guess what the next Connect IVR will take. You scoped the last few in CFP. You logged the hours against the tickets. You know the hours-per-CFP and the wrap percentage your team actually delivers at on Connect. The same approach gives you a separate, equally honest baseline for Genesys IVRs, for internal admin tools, for data pipelines or for any other category of work you do repeatedly. Same method. Different numbers. Both grounded in what actually happened rather than what someone hopes will happen.
That is the part that holds up regardless of where AI ends up. Models will get faster or they will not. The cost of functional code will keep falling or it will plateau. Either way, the right way to know what your team can deliver is to measure what your team has delivered. Tickets as source of truth, CFP as the unit of output, hours logged against the work, wrap captured alongside. The framework was useful before agentic coding. It is more useful now, because it is the only way to see the shift clearly enough to plan around it.
Closing the Loop: From Measurement to Estimation
Measurement on its own is interesting. Measurement that feeds back into the next project is useful. The whole point of calibrating an hours-per-CFP and a wrap percentage against your own delivered work is so that the numbers you use to plan the next piece of work are yours, not somebody else’s.
The next change I plan to make in hate closes that loop. The idea is straightforward. Once you have a few projects of a given shape in the system (say, three completed Genesys IVR builds), the tool already knows what they delivered (in CFP), what they cost (in hours) and how the hours split between functional and wrap. Those three projects define a profile: the hours-per-CFP and the wrap percentage your team actually delivers at on that kind of work.
When the next Genesys IVR comes along, the workflow looks like this. You scope it the same way you scoped the others. Claude Code breaks it into phases, generates tickets and counts the CFP on each one. At that point you have a sized but un-estimated project. Then you point the tool at the Genesys profile and say, in effect, “apply what we know about this kind of work.” The dashboard responds with an hours estimate built from your own measured rates, not from the 8 / 12 / 18 industry band and not from a 60% wrap assumption.
This is the part that brings the whole approach full circle. The same ticketing system that captured the size of the work, the hours that were logged against it and the wrap that surrounded it now uses that history to estimate the next one. The estimate is honest because it is built from delivered work, not promised work. It is specific because it is keyed to the kind of work you are actually about to do, not an industry average across every project shape. And it is repeatable because the inputs are right there in the repo, version-controlled alongside the code.
The implication for how projects get bid and staffed is significant. A profile that says “Genesys IVRs at our shop run at 0.2 hours per CFP with a 400% wrap” sounds strange against the old baselines, but it is the right kind of strange. It reflects the reality of an agentic delivery model: cheap functional code, expensive surroundings. A bid built from those numbers will be defensible. A bid built from a generic 12 hours per CFP and 60% wrap will be wrong by an order of magnitude, in whichever direction is least convenient at the time.
The endgame is not a smarter estimator. It is the end of estimation as an act of opinion. Once the loop is closed, the question “how long will this take” stops being a guess dressed up as expertise and becomes a lookup against measured precedent. That is what the CFP framework was always supposed to deliver. The combination of agentic counting, ticket-as-source-of-truth and profile-based application is what finally makes it practical.
An Open Question: Human CFP vs Machine CFP
One thing the current setup does not distinguish is who, or what, produced a given function point. A CFP is a CFP, whether the code behind it was typed by a human, generated by an agent or produced by some mix of the two. On a real project the mix is always present. Humans are in the loop doing configuration, reviewing output, writing the parts the model gets wrong and occasionally writing code outright because it is faster than explaining what they want.
The obvious extension is to tag each ticket with the share of work done by a human versus a machine and to report hours-per-CFP separately for each. That would let you see, with some precision, where the leverage actually comes from.
I am genuinely unsure whether it is worth doing.
The argument for is that without it, the aggregate hours-per-CFP number blends two very different cost structures into one. A project that is 90% agent-written and 10% human-written looks the same in the dashboard as one that is 50/50, even though the economics are different and the planning implications are different.
The argument against is that on coding tasks specifically, the agent-side cost is already so low that it is almost unmeasurable. Splitting a near-zero number into two near-zero numbers does not buy much insight. The interesting variation is not between human-coded CFP and machine-coded CFP. It is between functional CFP (collapsing fast) and the wrap around it (not collapsing nearly as fast). The split that matters is already captured.
For now, the practical answer is to keep the tool as it is and to read the aggregate number for what it is: a measurement of what the team delivered, regardless of who or what produced each line. The 70x figure from these three projects is the number that should change how a project gets scoped, bid and staffed. Whether that 70x is 60x human-assisted-by-agent or 90x agent-with-human-review is a second-order question. The first-order question, which is whether the old baselines still apply at all, the data has already answered.
I will revisit the split if and when a project comes through where the human-machine boundary matters enough that the aggregate hides something important. Until then, simpler is better.